
Creating reports
Any view you build can become a polished, interactive report in a couple of clicks, sent to clients and stakeholders without giving them account access.
Creating reports
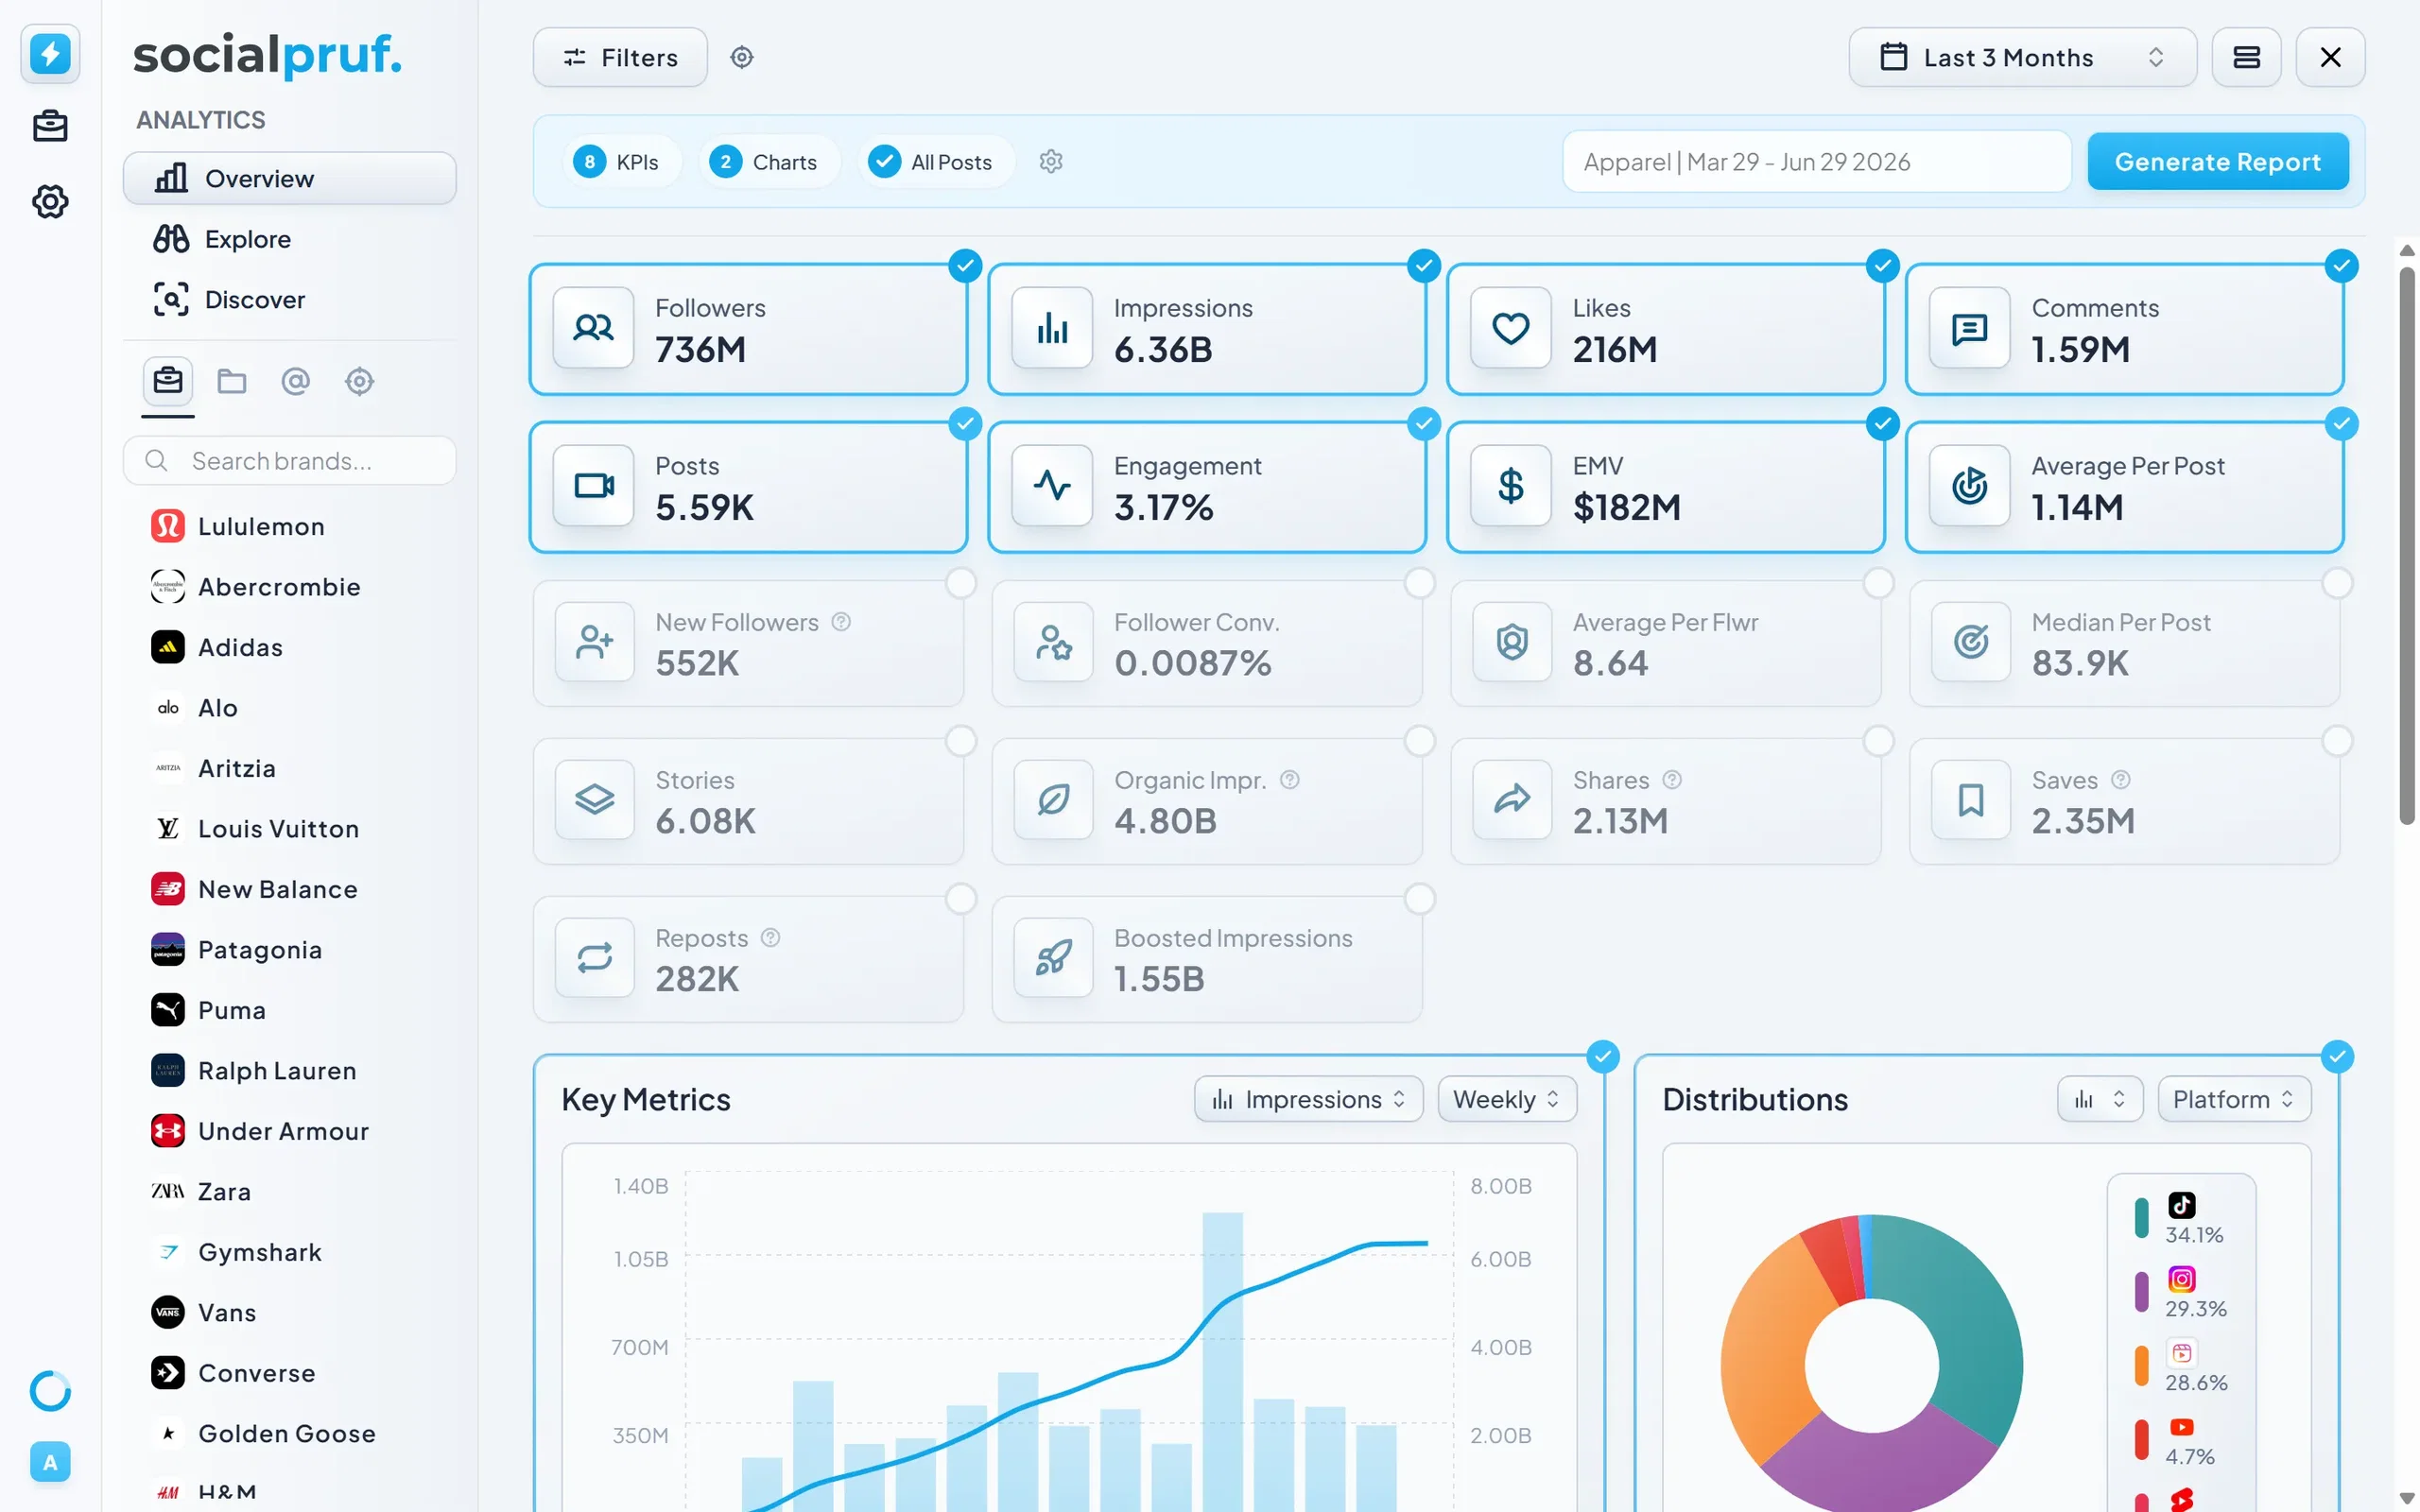
Any view you build in Socialpruf, including filters, comparisons, Table View, goals, and benchmarks, can be turned into a shareable report.
To create a report
- Set up the view in the configuration you want it to be shared.
- Click the Create Report arrow in the top right.
- Choose your report type:
- Public Link - Captures the default view of your dash in the date range set: the top 6 cards configured, the two charts and all of your content. Anyone with the link sees what you see.
- Custom Report - Custom reports allow you to add a custom report title, select dynamic filters and configure rolling dates. In custom reports you can select and deselect specific KPIs charts or posts to include, giving you full control over what the recipient sees.
Custom reports have a lot of hidden strengths. To start click the settings icon on the top bar to choose whether the report date is rolling. You can also decide if you want the report viewer to be able to select their own date range and platform filters. You can also include or exclude any posts from your shared reports without excluding their performance stats.
- Click Generate Report.
You'll receive a hyperlink you can share with anyone, clients, executives, team members. Recipients can interact with the report the same way you interact with the dashboard: clicking KPIs, exploring charts, and viewing content, without ever needing access to your full Socialpruf account. You can access all your previously generated report links in the manage page under the Reports tab.