Building custom KPIs
The metric your team reports on may not be one we ship. Build it yourself in the KPI Builder, out of your metrics, your costs, and your campaign budgets, and it becomes a KPI card like any other.
Building custom KPIs
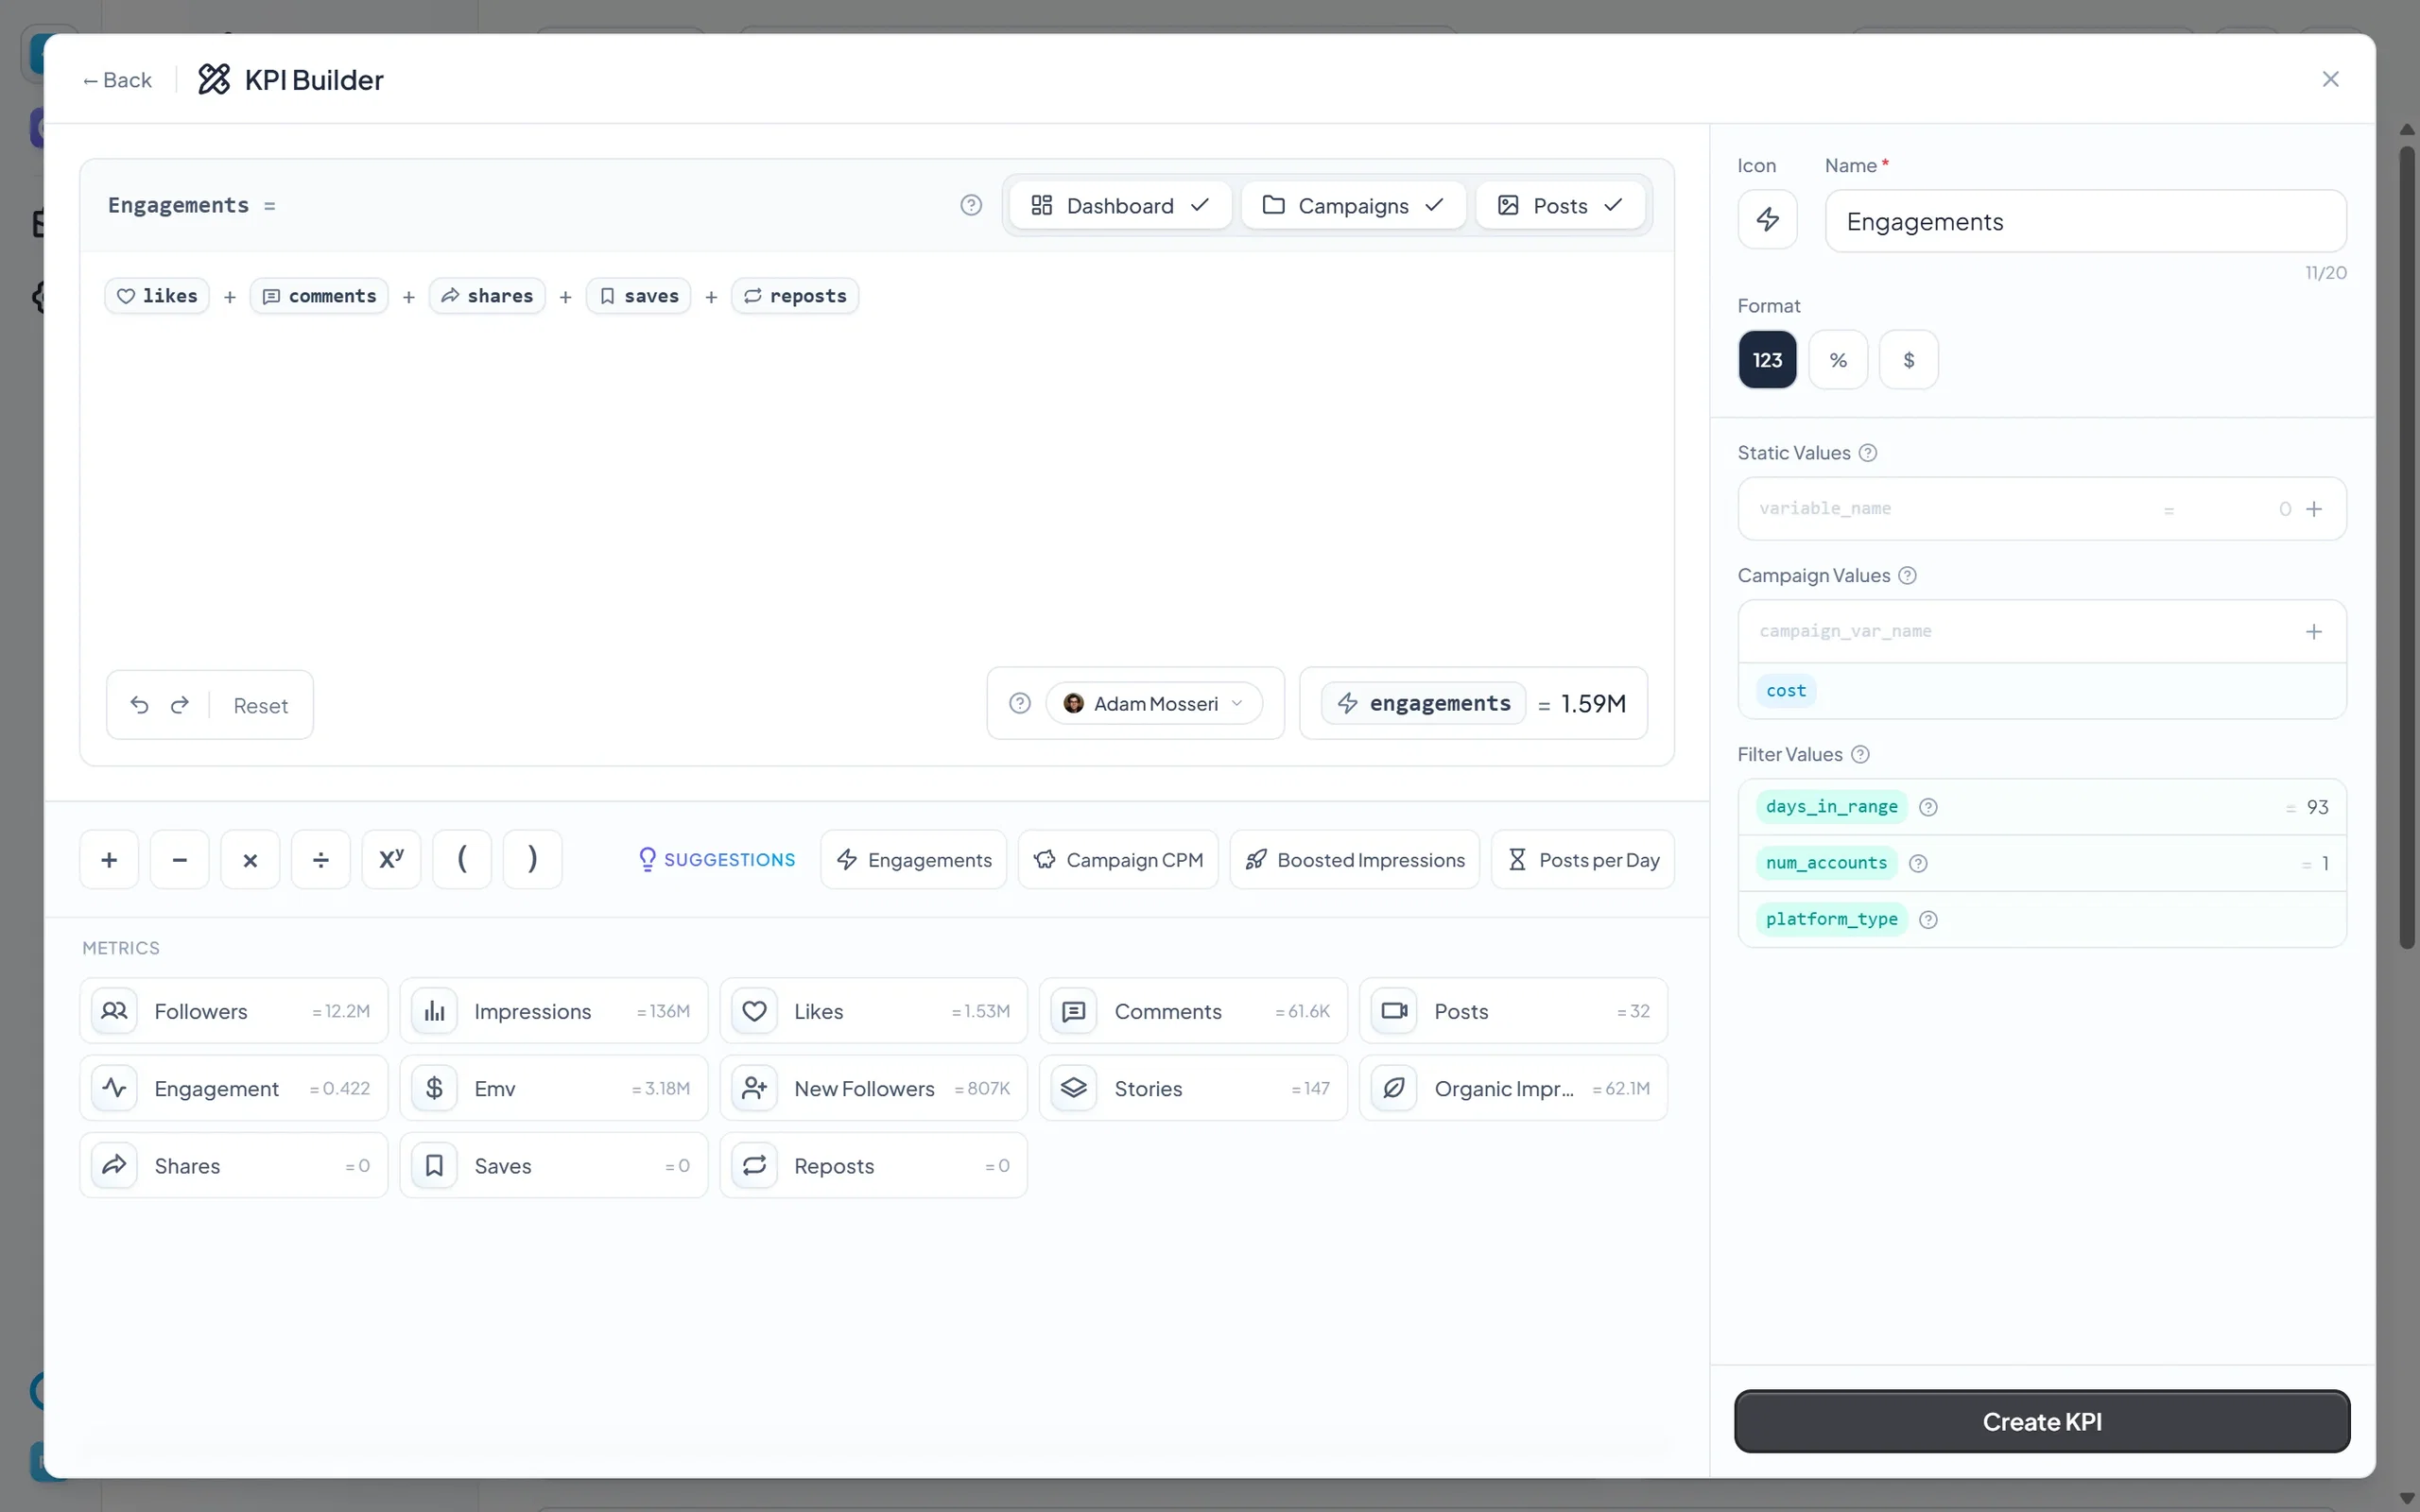
Every KPI card you've met so far is one Socialpruf ships. The KPI Builder lets you write your own: any formula built out of your metrics, your own costs, and the budgets attached to your campaigns. Once it's saved, a custom KPI behaves exactly like a built-in one. It sits in the KPI row, respects every filter, sorts your tables, rides along into reports and exports, and can carry a goal target.
It closes this chapter because it's the piece that makes the dashboard yours. If the number your team actually reports on isn't on the page yet, this is where you put it there.
Opening the KPI Library
Expand the KPI row at the top of the Overview Page and the last tile is the KPI Library. It lists every KPI on your team, built-in and custom, split into Active and Archived.
- Drag to reorder. The order you set here is the order your KPIs appear in everywhere else, on the dashboard, in Table View, and in reports.
- Archive takes a KPI off your dashboard without losing it. It drops into the Archived row and can be switched back on any time.
- Delete is only offered on custom KPIs your own team built.
- If you have more than one team in your workspace, a KPI built on one team can be activated on the others straight from its tile, so you don't rebuild the same formula twice.
Click the KPI Builder tile to start a new KPI, or open an existing custom one to edit it.
The builder
The builder is a calculator. On the left is the formula editor with a keypad of operators (+ − × ÷ xʸ and brackets) and, beneath it, every metric you can reference; click one to drop it into the formula rather than typing it. On the right you name the KPI, give it an icon, and pick its format.
- Name - up to 20 characters. It doubles as the formula's code name, so "Cost per Engagement" becomes
cost_per_engagementwhen another formula references it. - Format -
123,%or$. This only changes how the result is displayed, never how it's calculated.
Above the keypad, a live preview evaluates your formula against your real data as you type, so you can see the number before you commit to it. Use the scope selector next to it to preview against one specific brand, account, or campaign instead of everything at once.
Not sure where to start? The Suggestions row loads a working formula into the editor for you to adapt: Engagements, Campaign CPM, Boosted Impressions, and Posts per Day.
What you can put in a formula
A formula is built from four kinds of value, color-coded in the editor so you can tell at a glance what a number is coming from.
- Metrics - the raw numbers Socialpruf already tracks: followers, impressions, likes, comments, shares, saves, reposts, posts, stories, new followers, engagement rate, EMV, and organic impressions.
- Static Values - constants you define once and reuse across every formula, like
cost_per_post = 250orhourly_rate = 65. Change the value in one place and every KPI that uses it updates. - Campaign Values - a placeholder you fill in per campaign.
costis built in; add your own for anything that differs campaign to campaign. You set the actual numbers on each campaign (in the campaign sheet under Campaign Variables), or inline from the KPI's formula panel. - Filter Values - computed automatically from whatever you've got filtered right now.
days_in_rangeis the length of your selected date range,num_accountsis how many accounts are in view, andplatform_typeassigns a weight per platform.
You can also reference another custom KPI by name, which keeps long formulas readable: build Engagements once, then write cost / engagements instead of repeating the whole sum.
Using platform_type
platform_type is the one that isn't obvious. It holds a separate number for each platform (Instagram, Reels, TikTok, YouTube, Shorts, X, Facebook, LinkedIn), and when you multiply a metric by it, Socialpruf works the metric out for each platform on its own and then adds the results together.
- Set TikTok to
1and everything else to0andimpressions * platform_typegives you TikTok impressions only. - Give each platform its own rate and
impressions * platform_typebecomes a blended value that prices each platform correctly.
Some formulas to steal
- Engagements -
likes + comments + shares + saves + reposts - Campaign CPM -
(cost / impressions) * 1000, set to currency format - Boosted Impressions -
impressions - organicImpressions, the reach we estimate came from paid boosting - Posts per Day -
posts / days_in_range, which self-adjusts to whatever date range you have selected - Cost per Engagement -
cost / (likes + comments + shares)
Missing metrics count as zero, not as an error. Not every platform reports every metric (reposts come from X and LinkedIn, saves from X and TikTok), so a formula that adds all five engagement types still works across a mixed set of accounts. It simply contributes nothing where the platform doesn't supply the number.
Where your KPI shows up
Each custom KPI has three surfaces you can switch on or off independently, using the toggles above the formula editor (or later, from the KPI's tile in the KPI Library):
- Dashboard - the KPI row and charts on the Overview Page.
- Campaigns - campaign rows and the campaign view.
- Posts - individual post cards and the post modal in Explore.
Click a custom KPI card on the dashboard to open its detail panel, where you get its value over time, the top posts driving it, and the formula itself. If the formula uses a campaign value, you can click that value in the formula and fill it in for each campaign without leaving the panel.
Custom KPIs as goal targets
Custom KPIs appear in the goal pop-up alongside the built-in metrics, so you can set a target on your own number exactly as you did in the last lesson. Two things to know:
- A KPI built on a campaign value only appears once you've filtered to a campaign — without one, there's no cost or budget for it to read.
- KPIs that add up cleanly day by day (sums and differences of metrics) get the full projection graph. Ratio-style KPIs that multiply or divide two metrics together can't be split into daily bars that reconcile with the total, so those show a live value against your target instead of a projection.
Deleting a value you've used: removing a static value leaves the formulas that referenced it intact, with the number hardcoded in its place. A campaign value that's in use in a formula can't be deleted until you take it out of that formula, so a KPI can never quietly stop calculating.