
Comparing entities
Put any two brands, accounts, or campaigns head to head and see exactly how they stack up across every KPI, for whatever period you choose.
Comparing entities
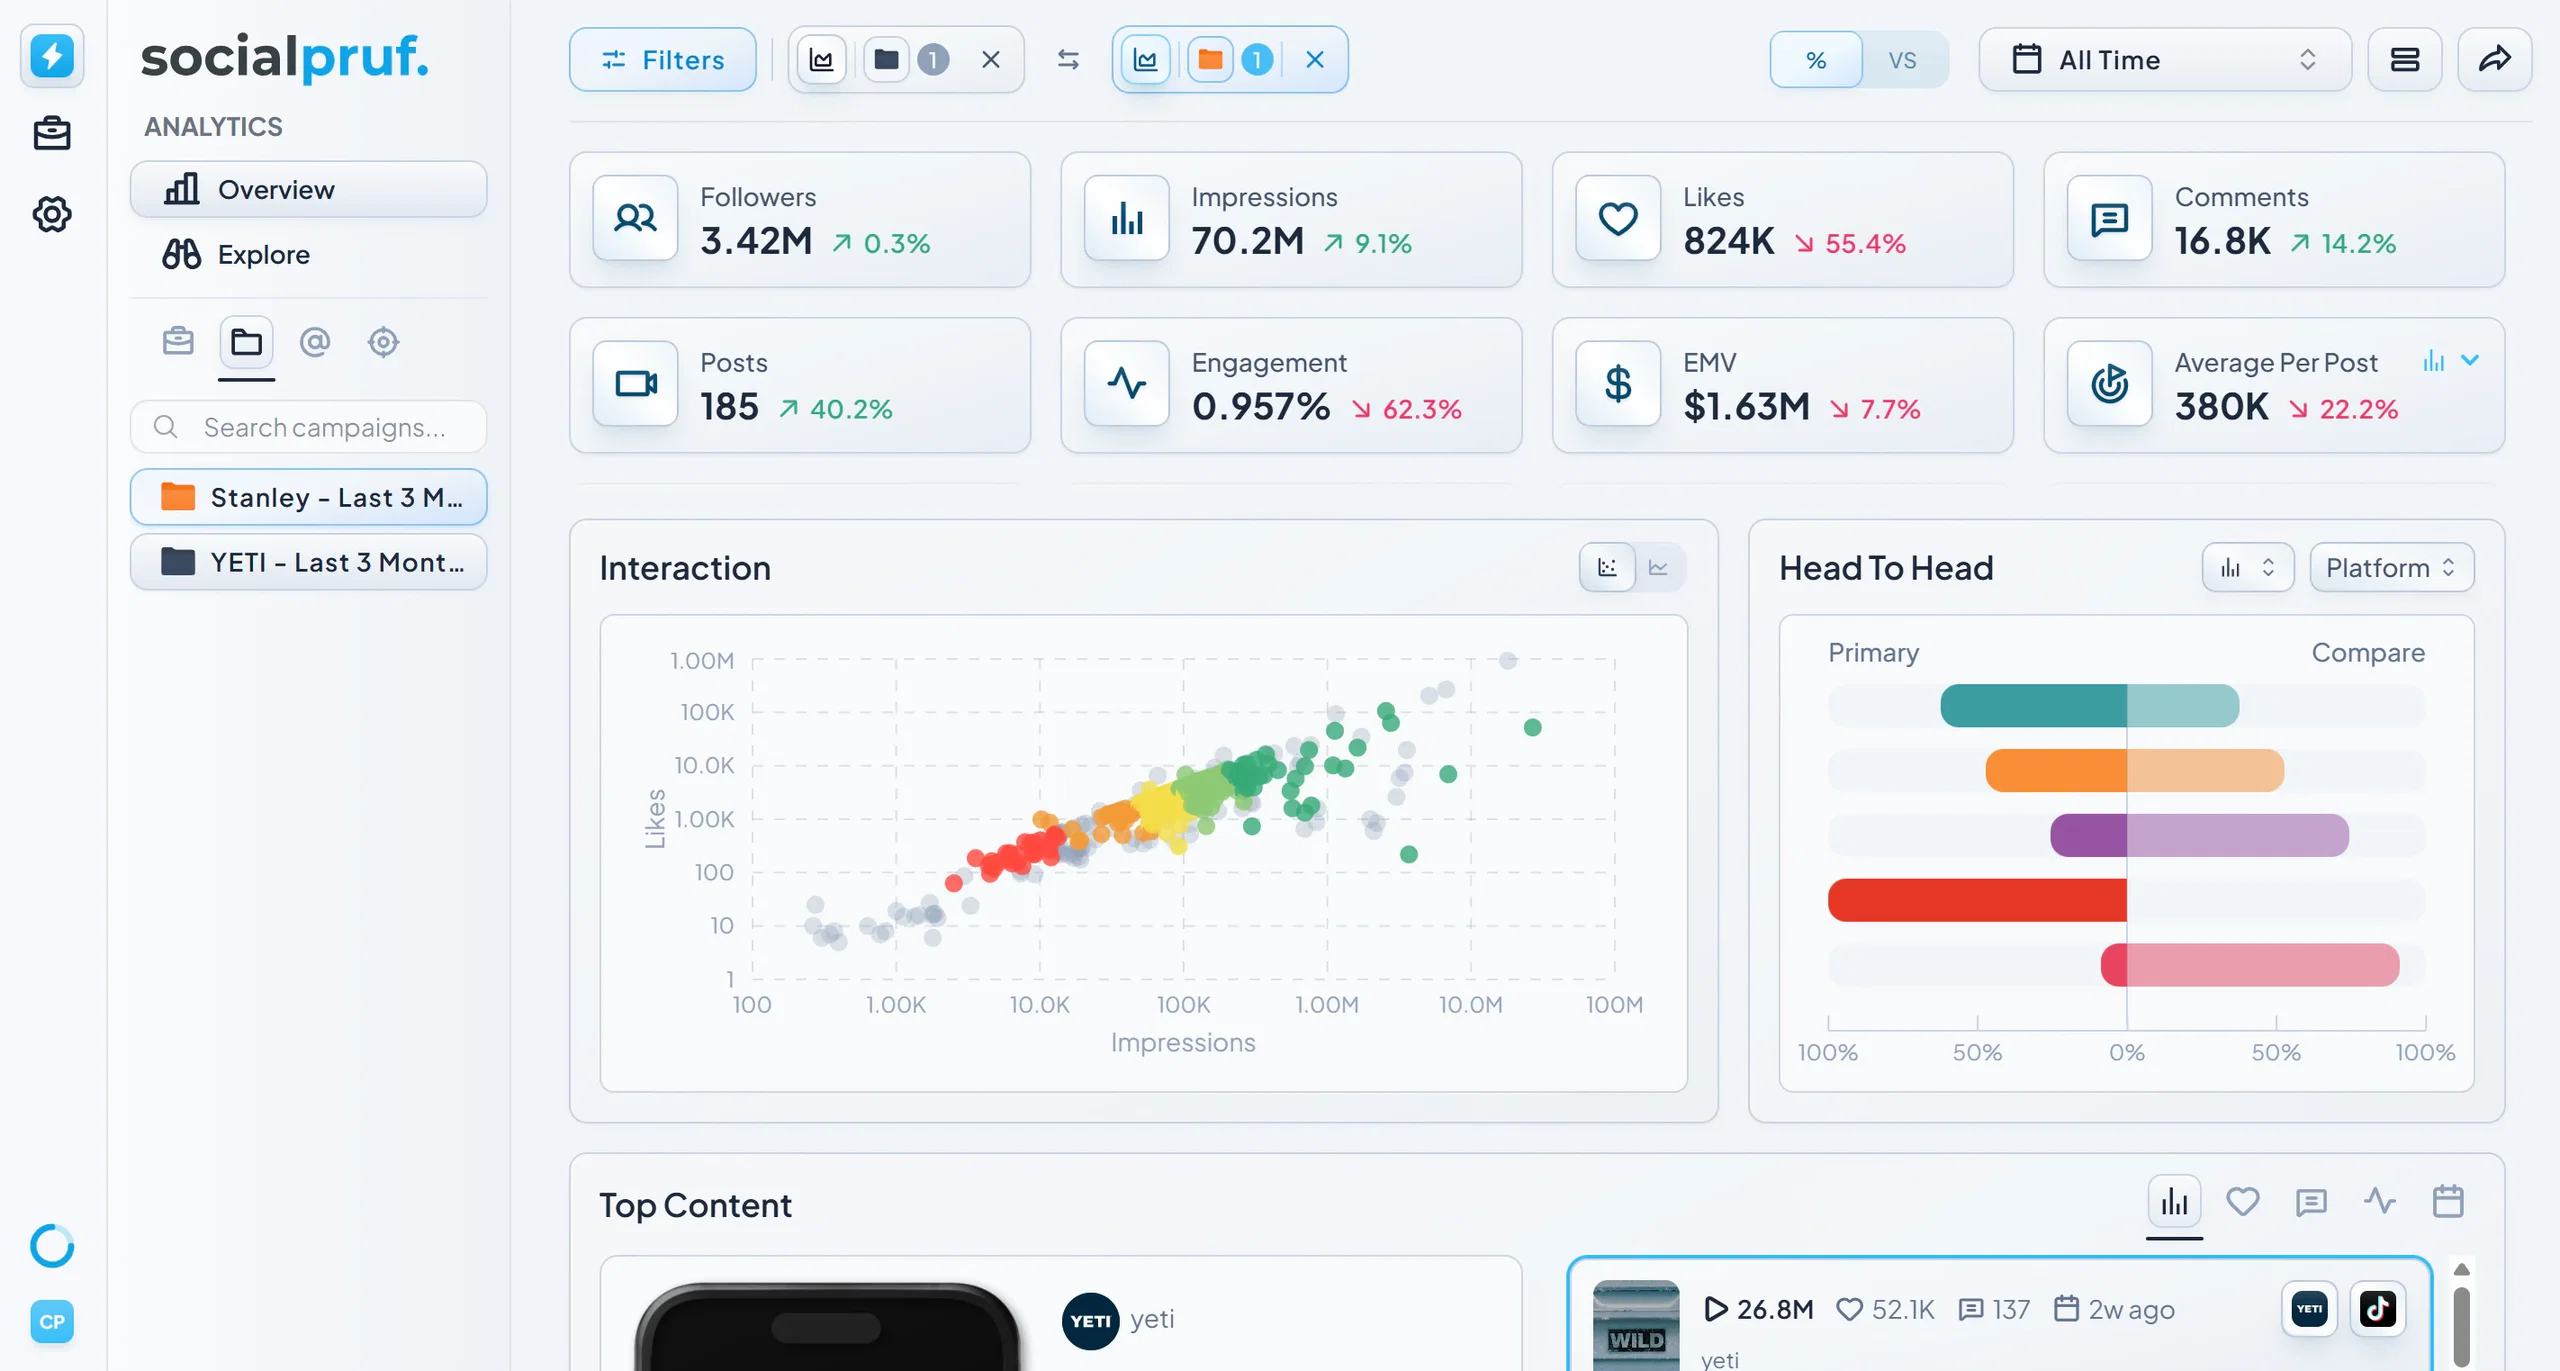
One of the most powerful features of the Overview Page is side-by-side comparison.
To compare two entities
- Apply a filter for a single brand, account, or campaign at the top of the dashboard.
- Click the three dots next to the filter and select Compare.
- Choose the second brand, account, or campaign you want to compare against.
- Click Compare in the bottom right.
The dashboard transforms into a side-by-side view, showing how each entity performs across every KPI for the selected date range.
What you can do in Compare mode
- Change the date range at any moment
- Toggle between percentage difference and whole-number difference to see the gap two ways.
- Review the Key Metrics graph in comparison mode. Both properties plot together on whichever KPI you've selected.
- Review the Head-to-Head graph to see the comparisons of your selected KPI and category.
Using compare will give you a competitive edge in understanding industry success — and you will struggle to find a better competitor analysis tool on the market.