
Report stats
The Reports tab is home to everything you've shared. See who is opening each report, how often they return, and where those views come from.
The Reports Tab
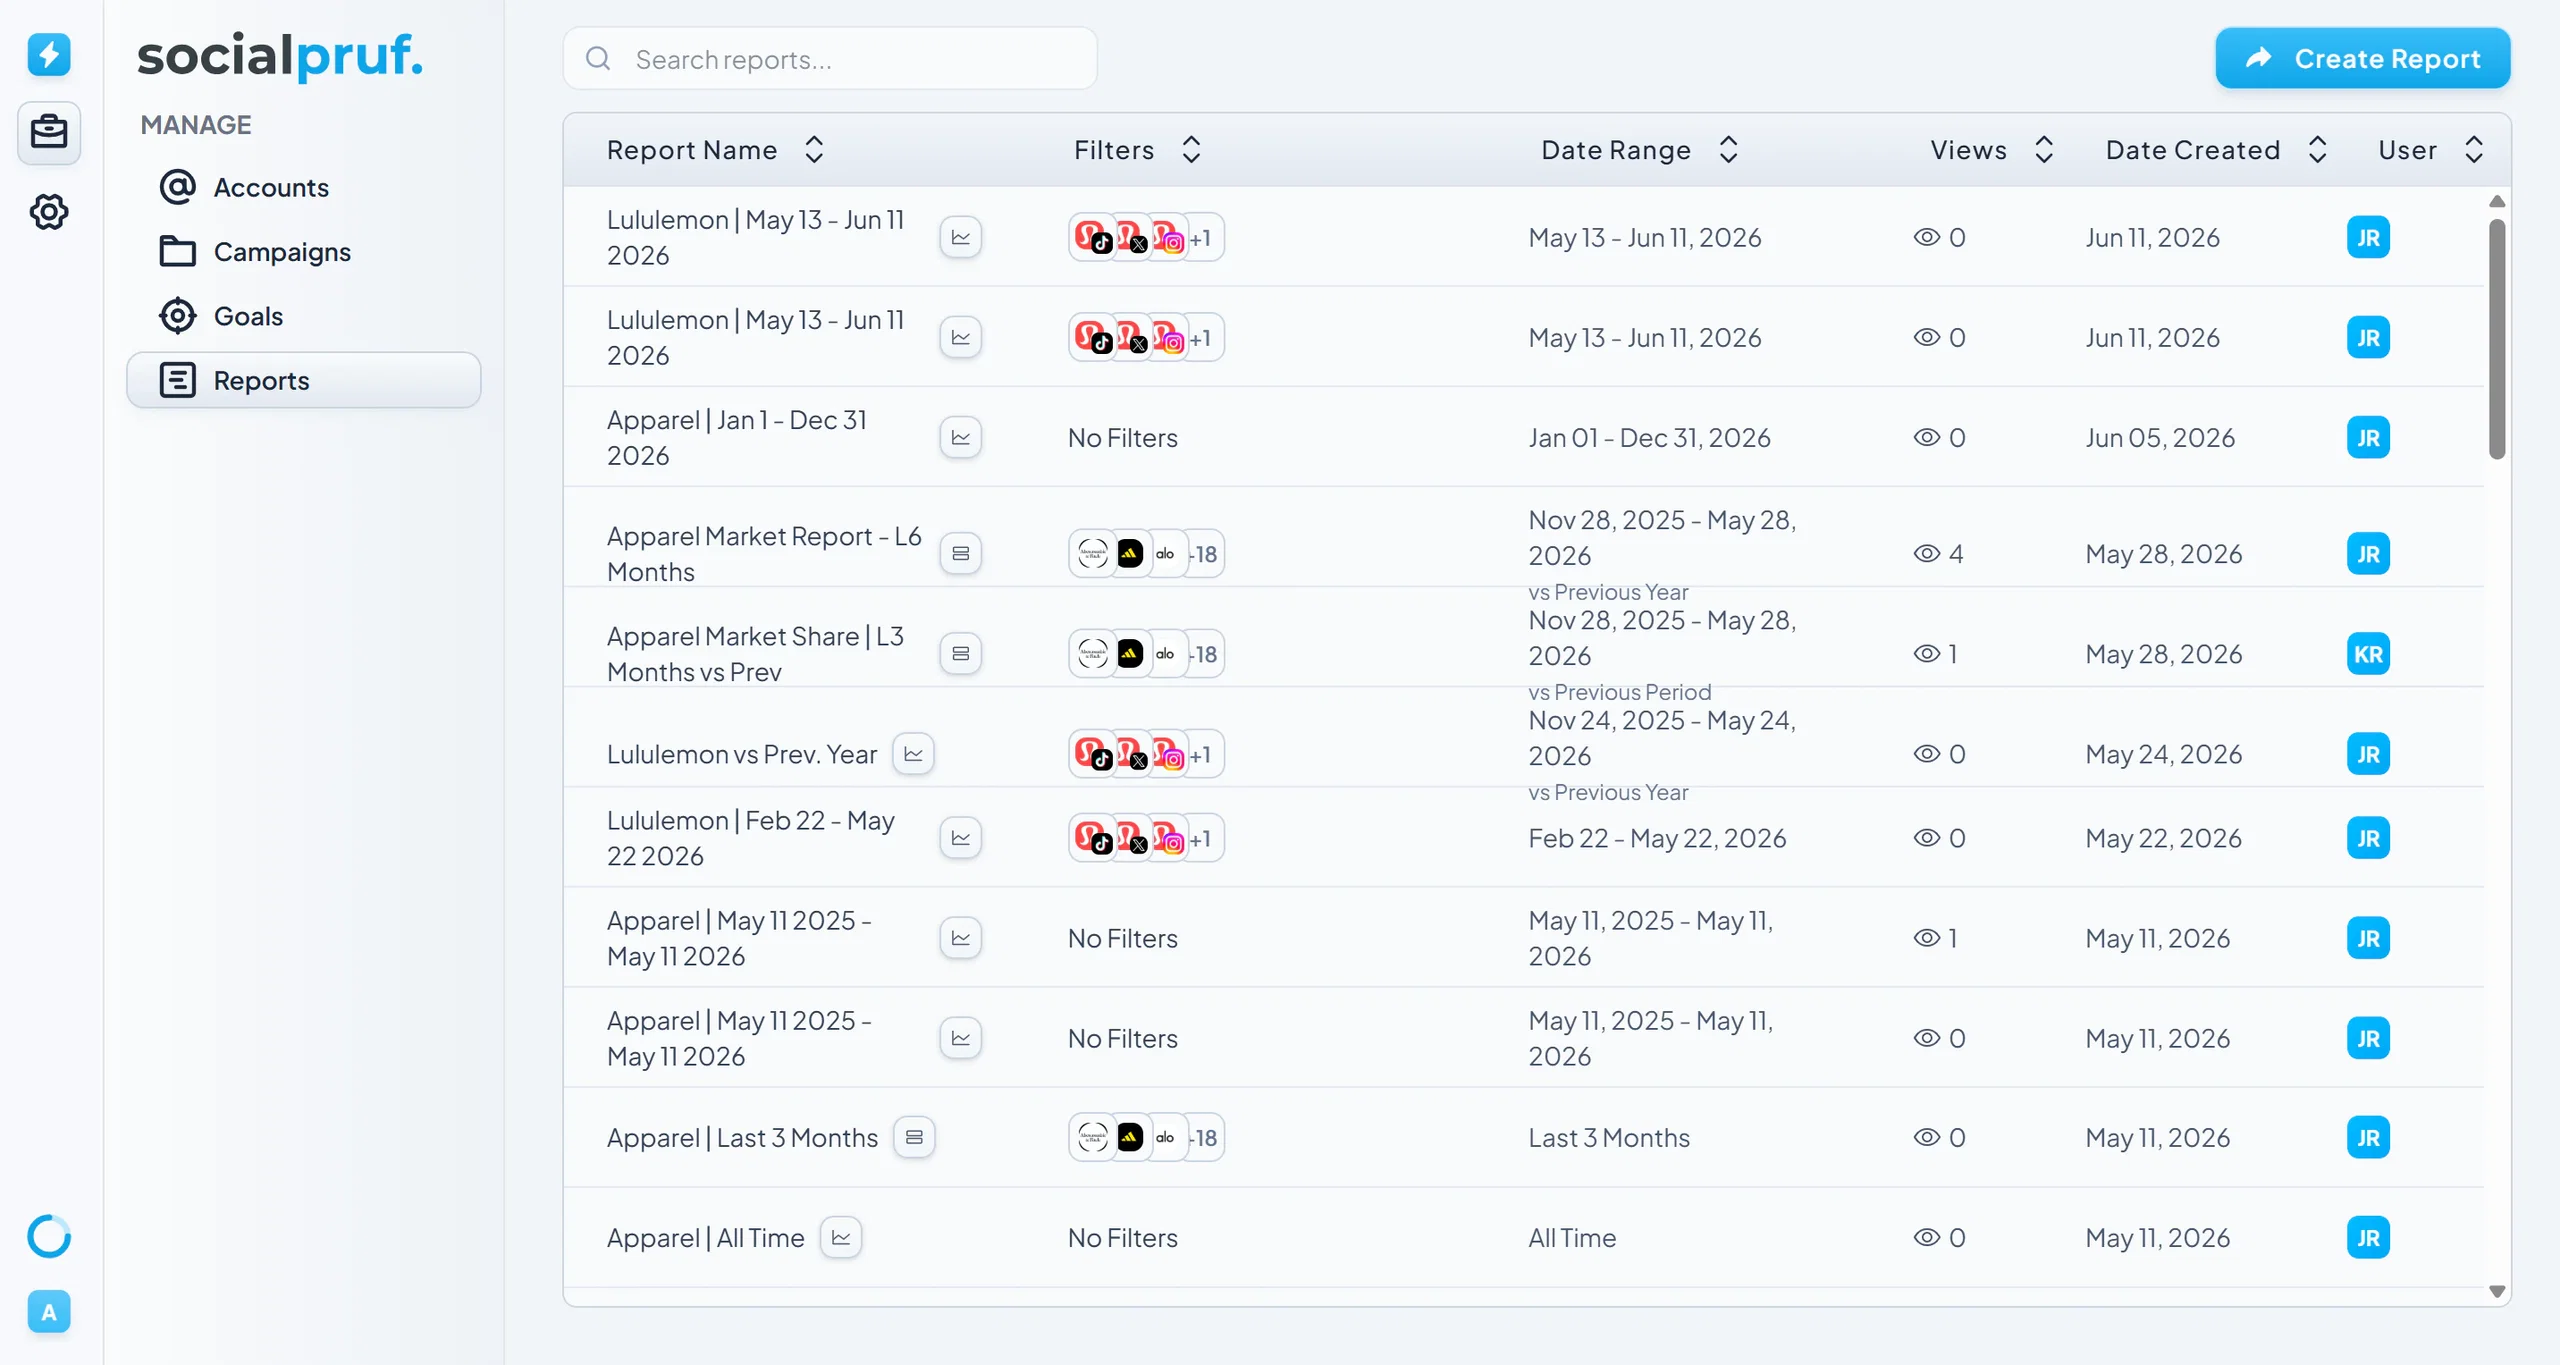
The Reports tab back in manage is where every report you've generated lives. It's a table view of all your past reports, with built-in search so you can quickly find older ones.
What you can see at a glance
For each report in the table, you can pull up its shareable link, see when it was created, and access it directly. Reports continue to update on the hour, so a link you shared weeks ago is still showing current data to whoever opens it.
Tracking report engagement
Click into any report to open its detail view. From here you'll see:
- The current KPIs the report is displaying.
- How many times the link has been opened and how many distinct people have viewed it.
- A heat map of where your reports have been opened around the world.
Pro tip: Use views and unique visitors to gauge how engaged your stakeholders are with the reports you send. A high view count from a small number of visitors usually means a client is checking in regularly; a useful signal for account management.