Editing reports
Keep a live report useful after you share it. Update its title, KPIs, charts, settings, and visible content without changing its link.
Editing reports
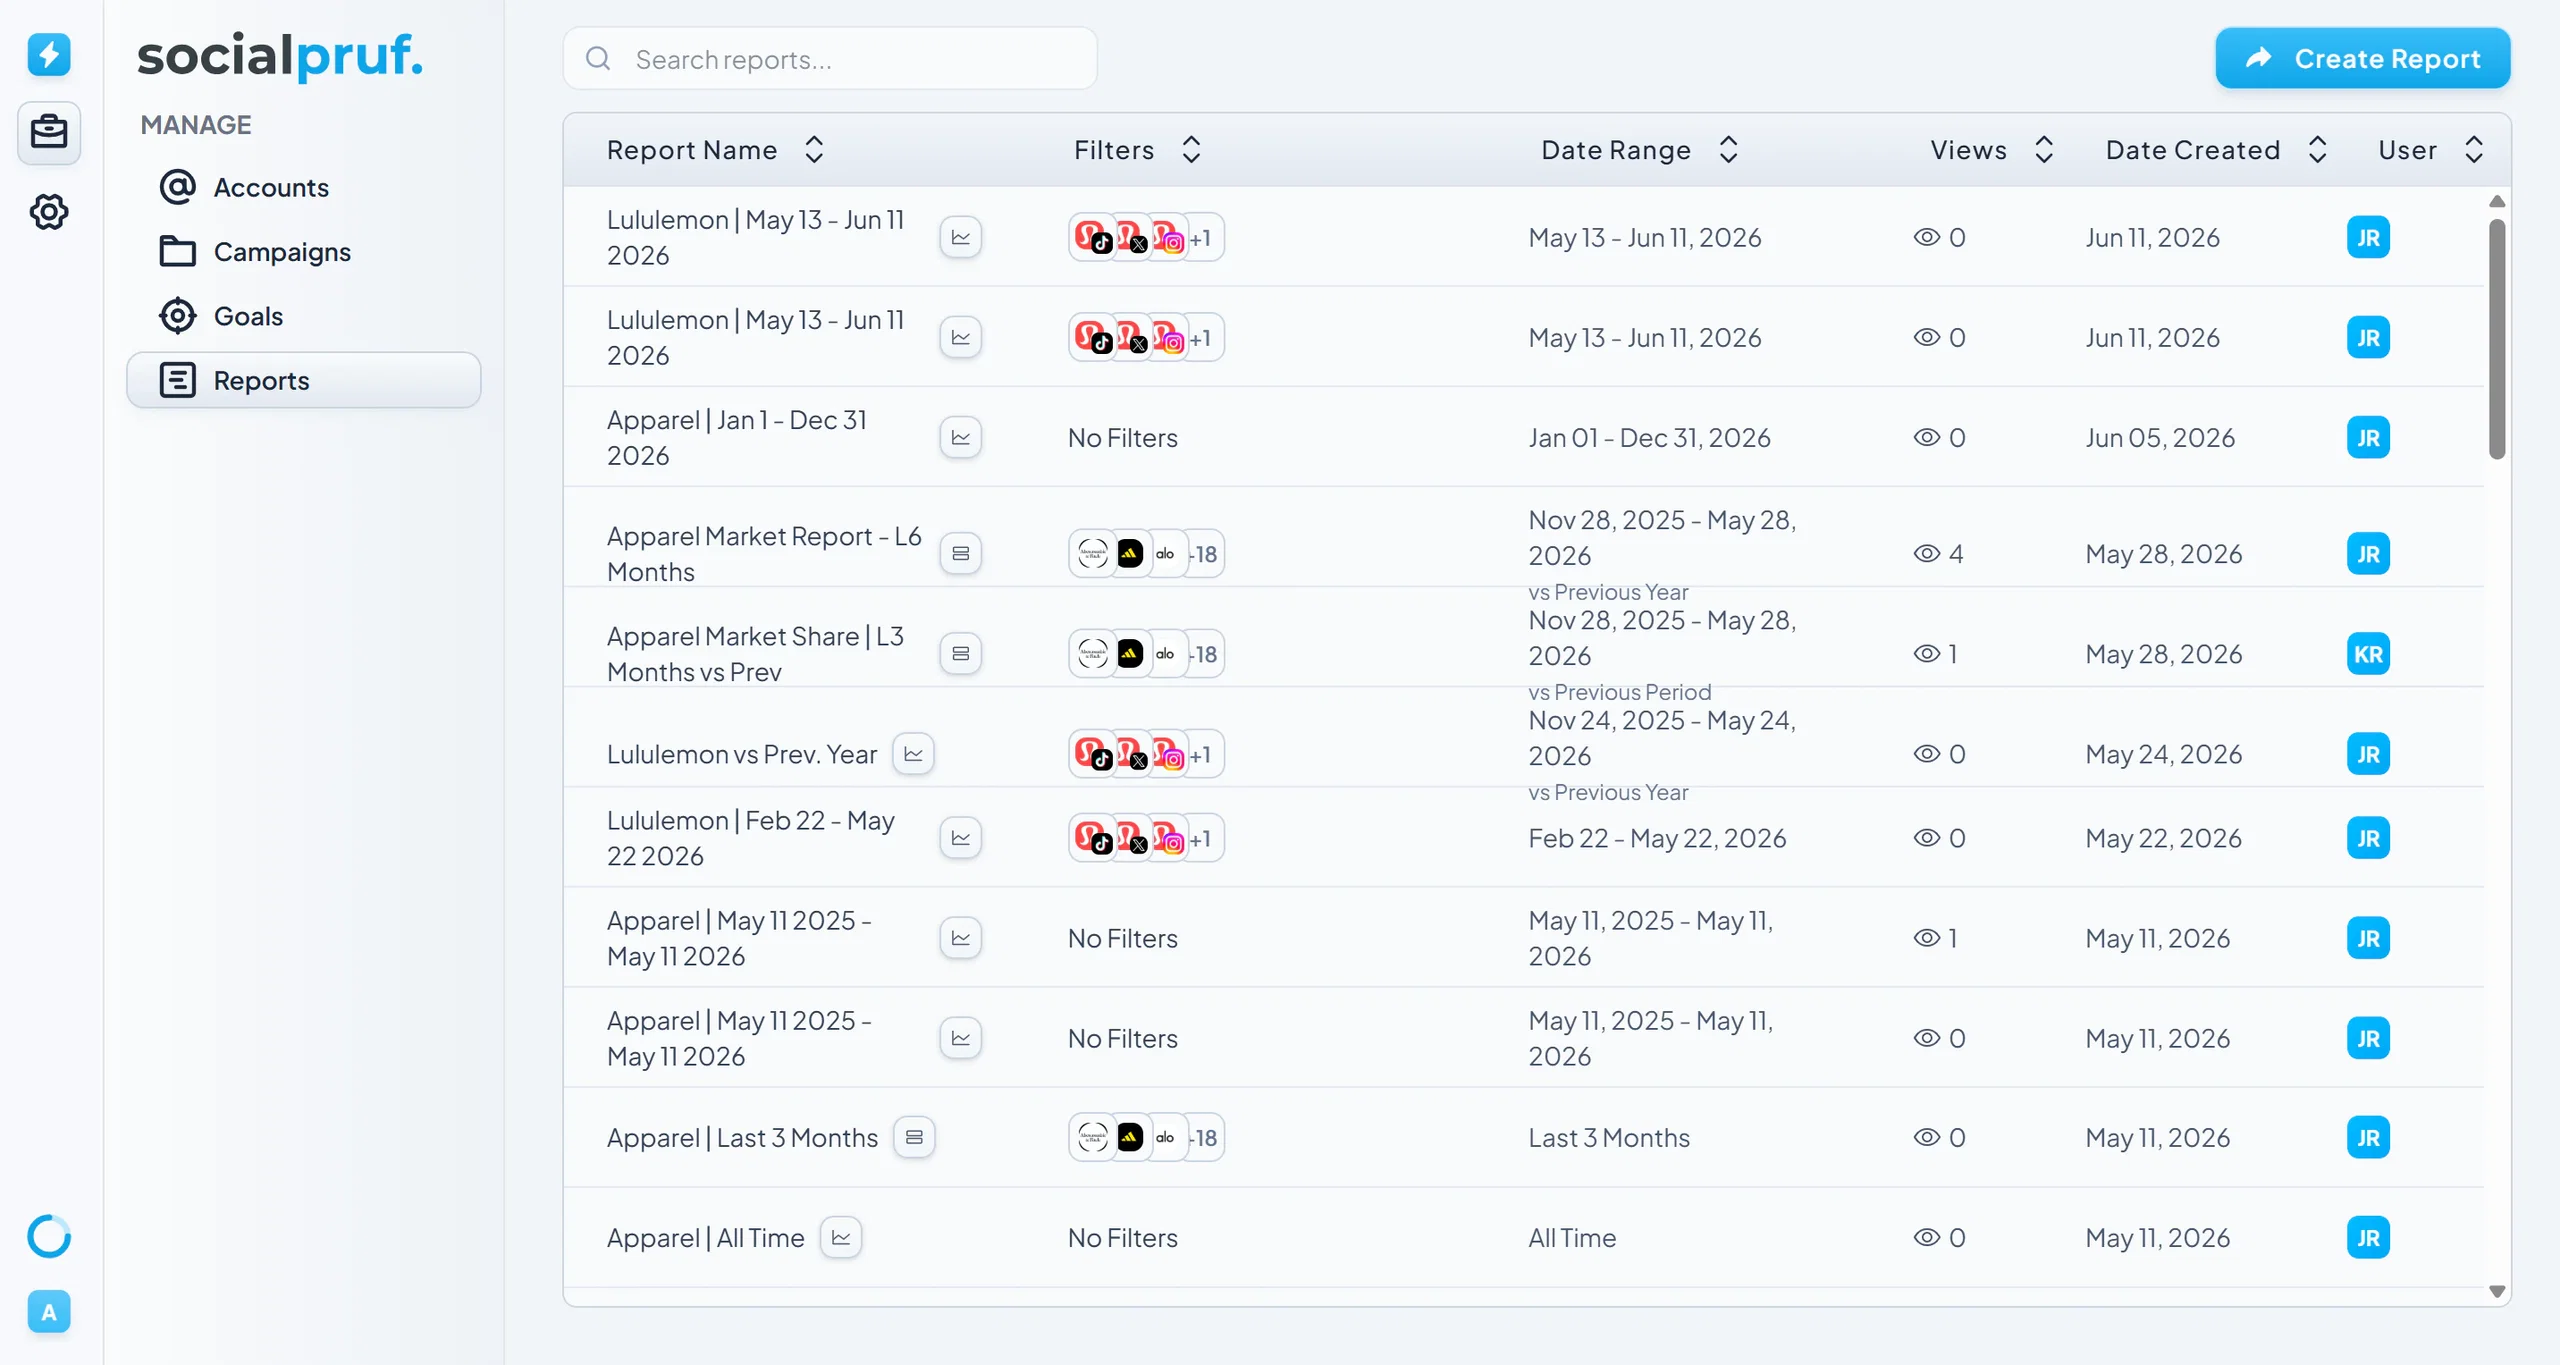
A report link is live; it keeps updating on the hour for whoever you sent it to. That means editing a report changes what your client or executive sees the next time they open the same link, without you having to send a new one.
Opening the editor
- Go to the Reports tab and click into the report you want to change.
- Click Manage to open the editing panel.
What you can change
- Title - the name at the top of the report and in your Reports list.
- KPIs - tick which KPI cards appear. In a comparison report you can also set whether KPIs display as a straight comparison or as a percentage difference.
- Charts - choose the metric and grouping for the interaction and distribution charts, or set either to Hidden to leave it out.
- Advanced settings - Date selector adds a date range picker to the report header so viewers can choose their own window, Platform selector adds a platform filter, and Dynamic brand resolves accounts from the brand when the report is opened, so newly added accounts appear automatically.
- Content - select any posts you'd rather not show and remove them from the report. Their performance still counts toward the KPIs and charts; they just aren't displayed.
The filters the report was built with are listed at the top of the panel so you can confirm its scope. Those are locked in when the report is generated; to report on a different slice, set the view up again on the Overview page and generate a new report.
Sharing, downloading, and deleting
- Copy the share link - on the right side, copy the link and send it on. Recipients get a live, interactive report without needing an account.
- Download as PDF - the Download button in the bottom right saves a static copy for archiving or board decks.
- Delete the report - Delete in the bottom left removes it permanently, and the shared link stops working immediately. Confirm nobody still needs it first.
Creating reports, tracking how often they're opened, and the rest of the Reports tab are covered in full in the Share insights chapter.