
Post level metrics
Sometimes the answer is in one post, sometimes in all of them. Open any post for its full stats, or switch to Table View to compare them row by row.
Diving into individual posts
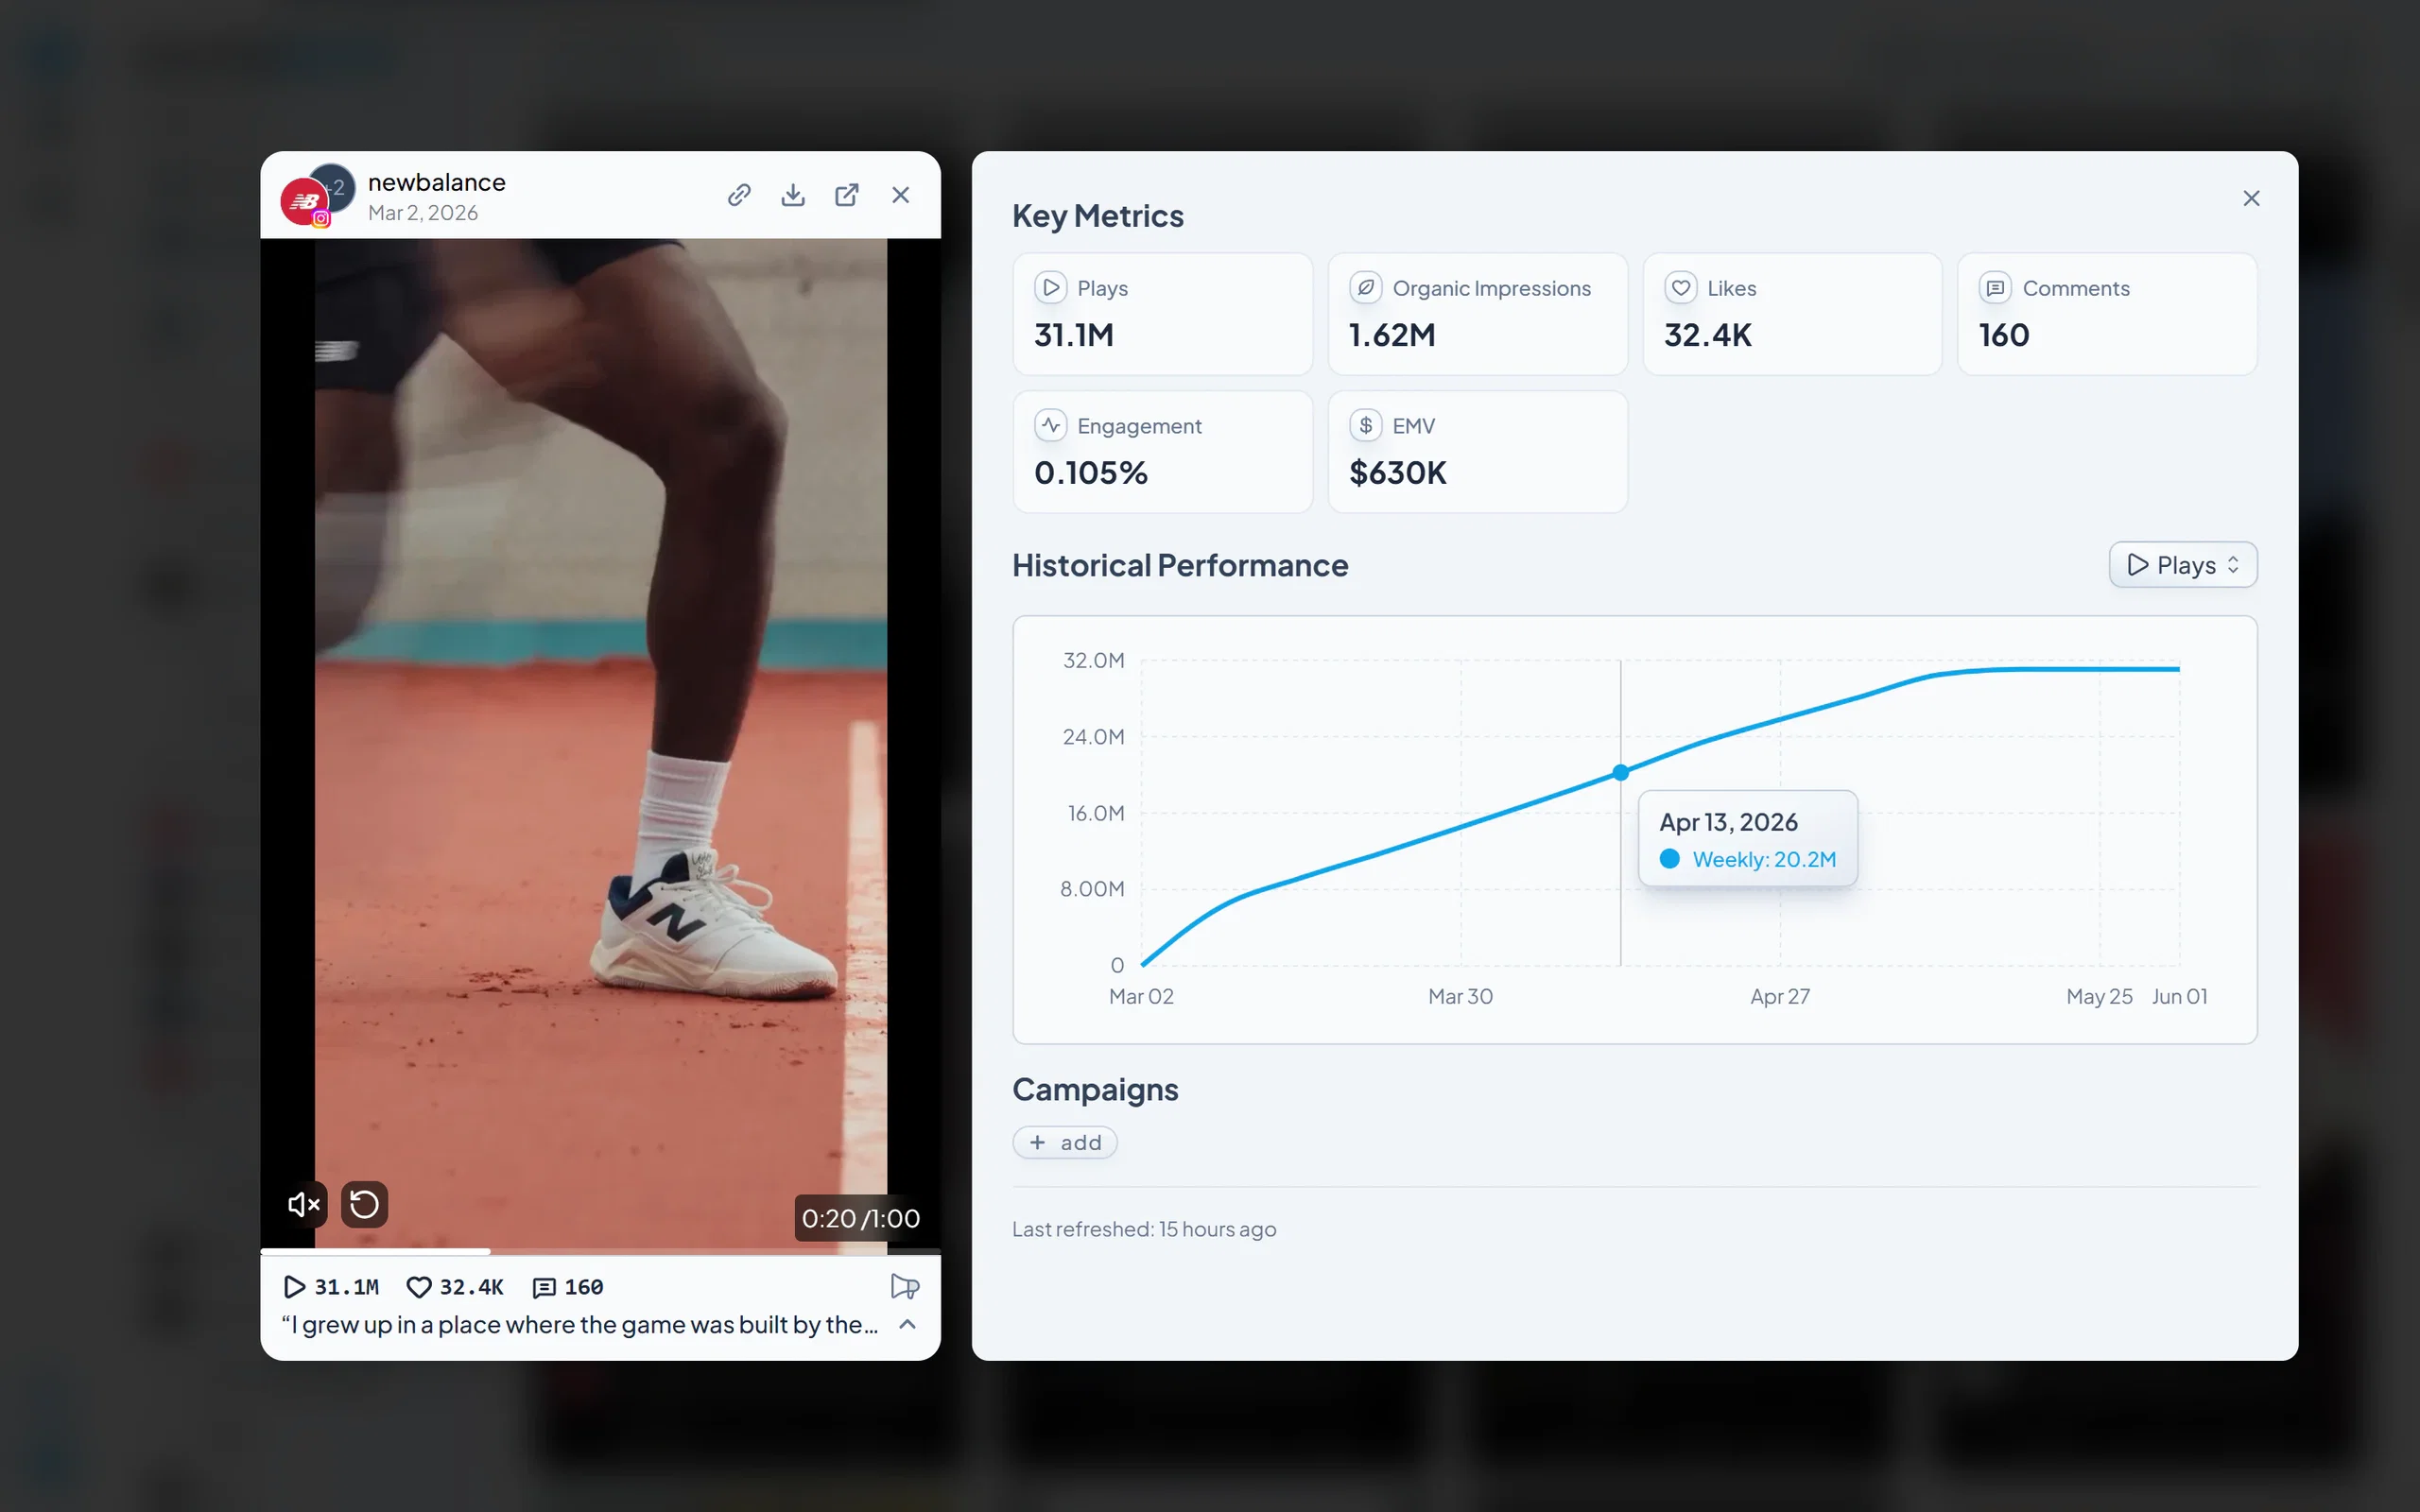
Click any tile in the grid to expand the post into a full preview. From the expanded view, you can:
- Watch or view the content directly inside Socialpruf.
- Copy a share link for the Socialpruf analytic post view.
- Download the media (image or video).
- View the original post on its native platform.
On the right side of the expanded view, click the expand post stats button. This reveals every granular KPI available for that specific post; every metric Socialpruf has collected for it, in one place.
Switching to Table View
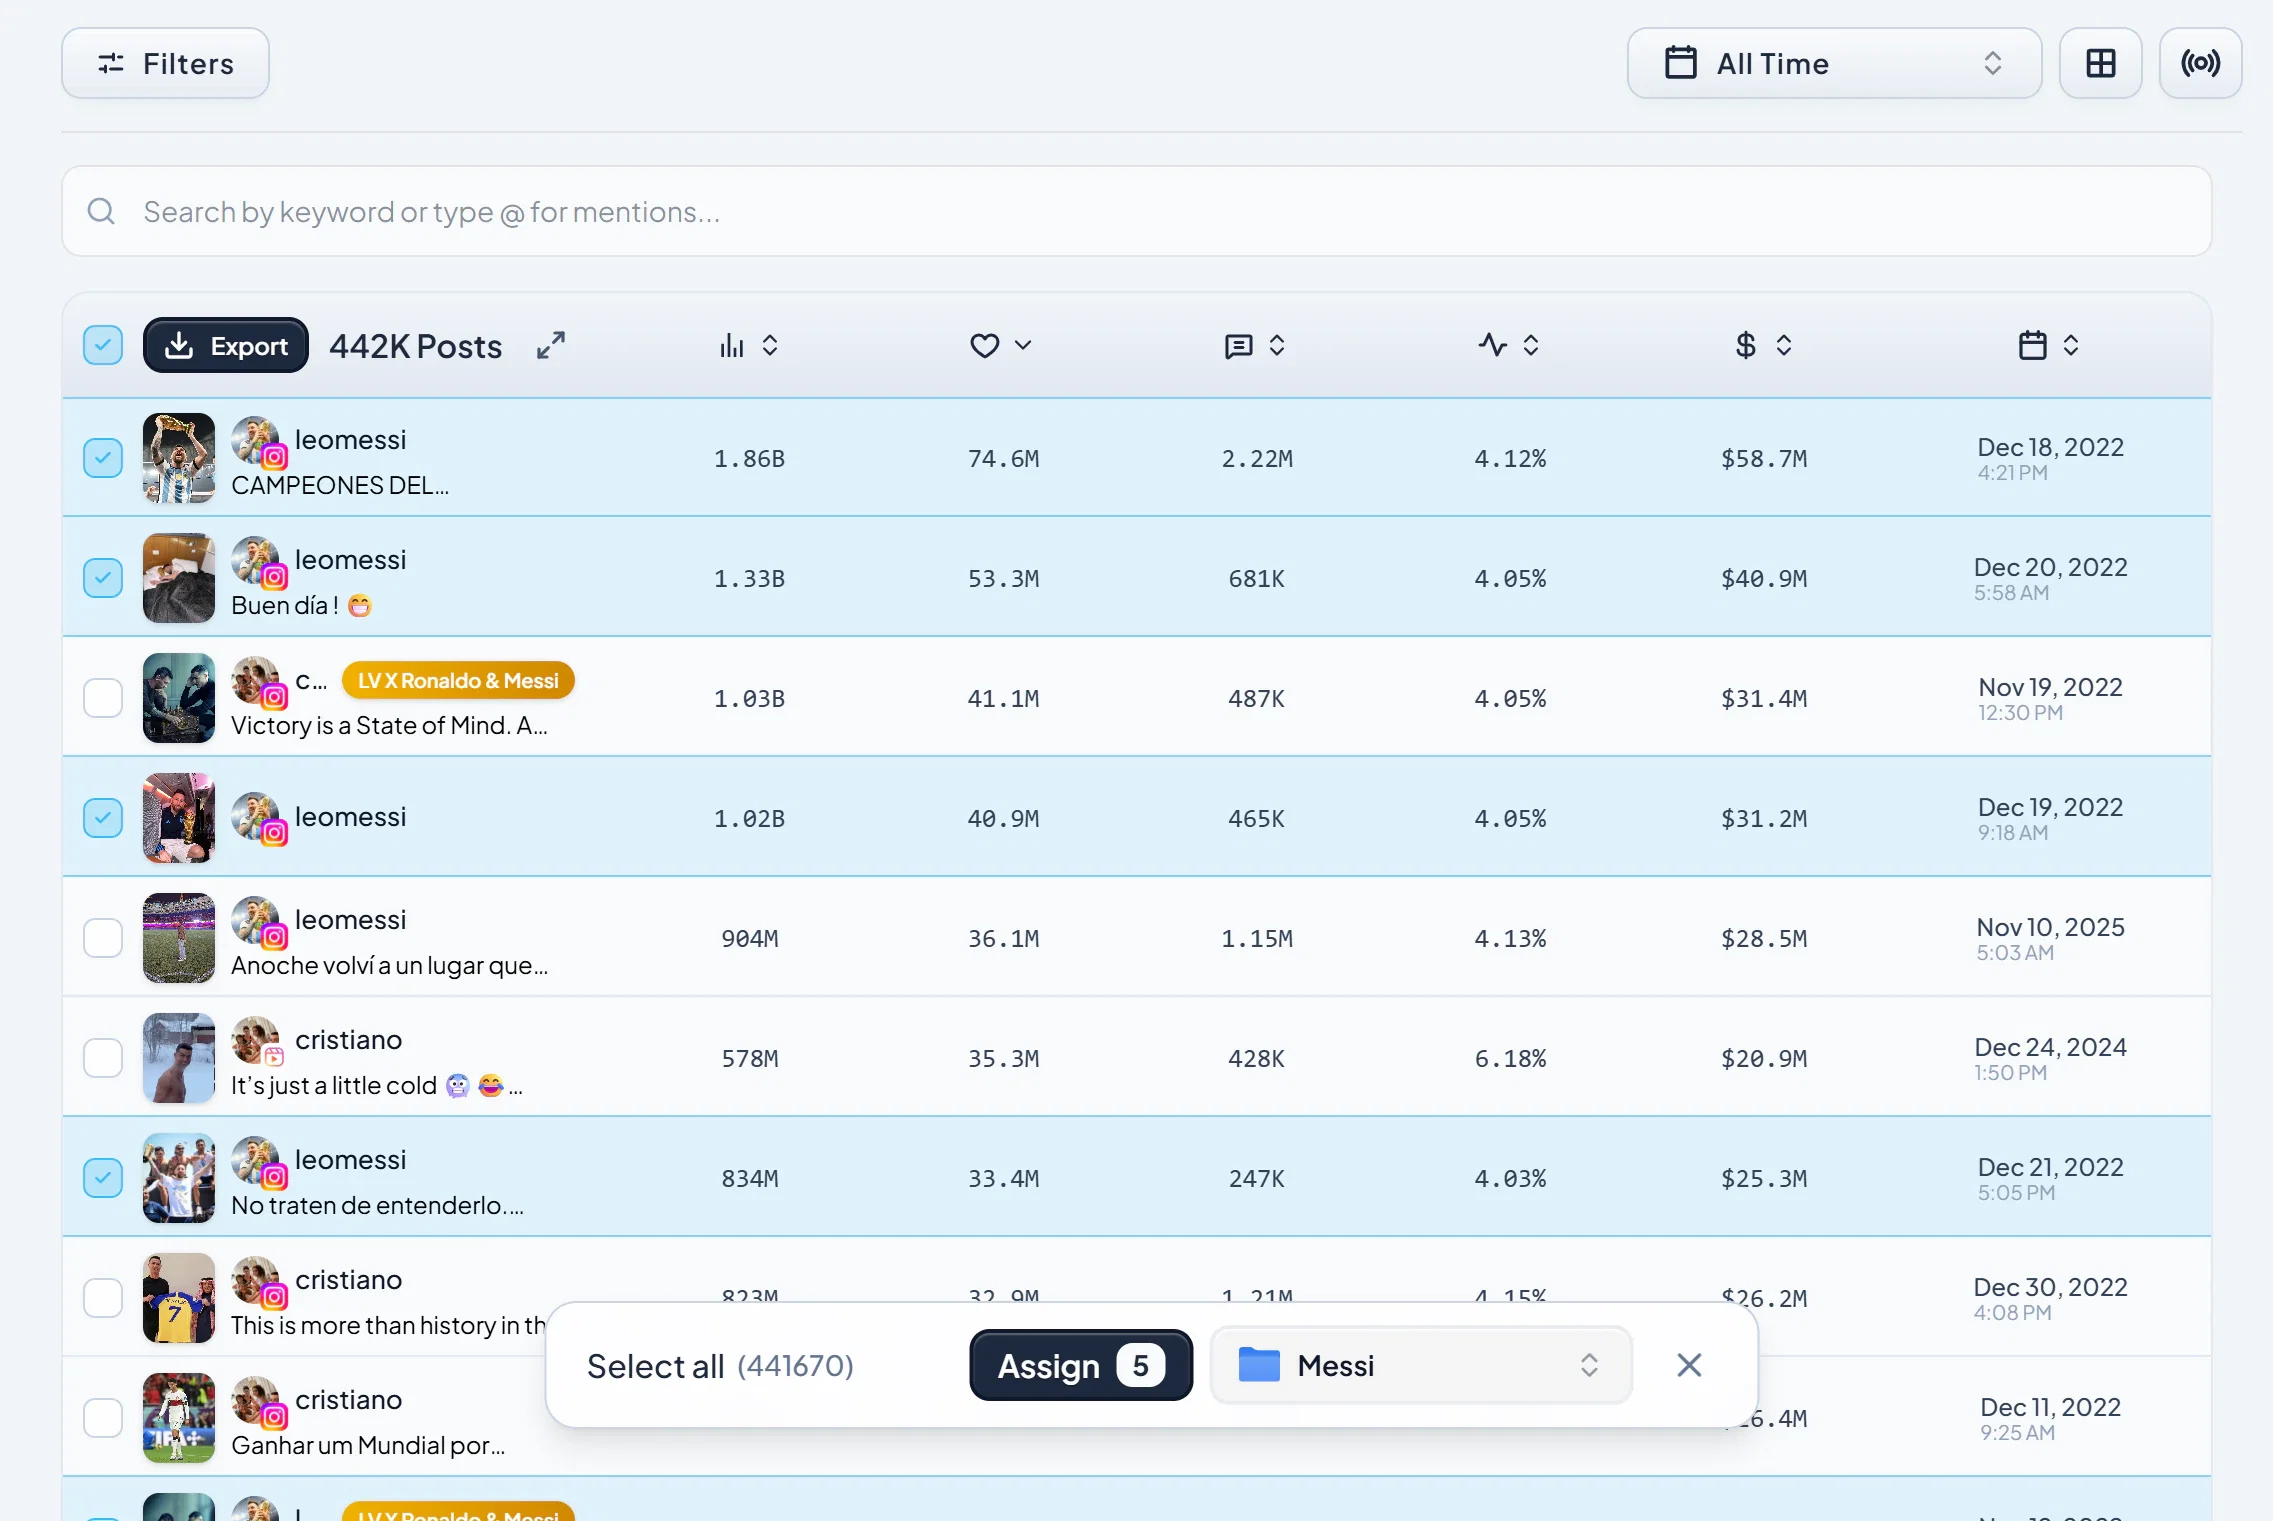
In the top right of the Explore page, right next to the date range filter, click Table View to switch the layout from grid to a spreadsheet-style table.
In Table View, you can see individual post-level content alongside its metrics in columns, perfect for:
- Bulk-comparing posts side by side
- Exporting or scanning content data quickly
You can toggle back to the visual grid at any time using the same control.