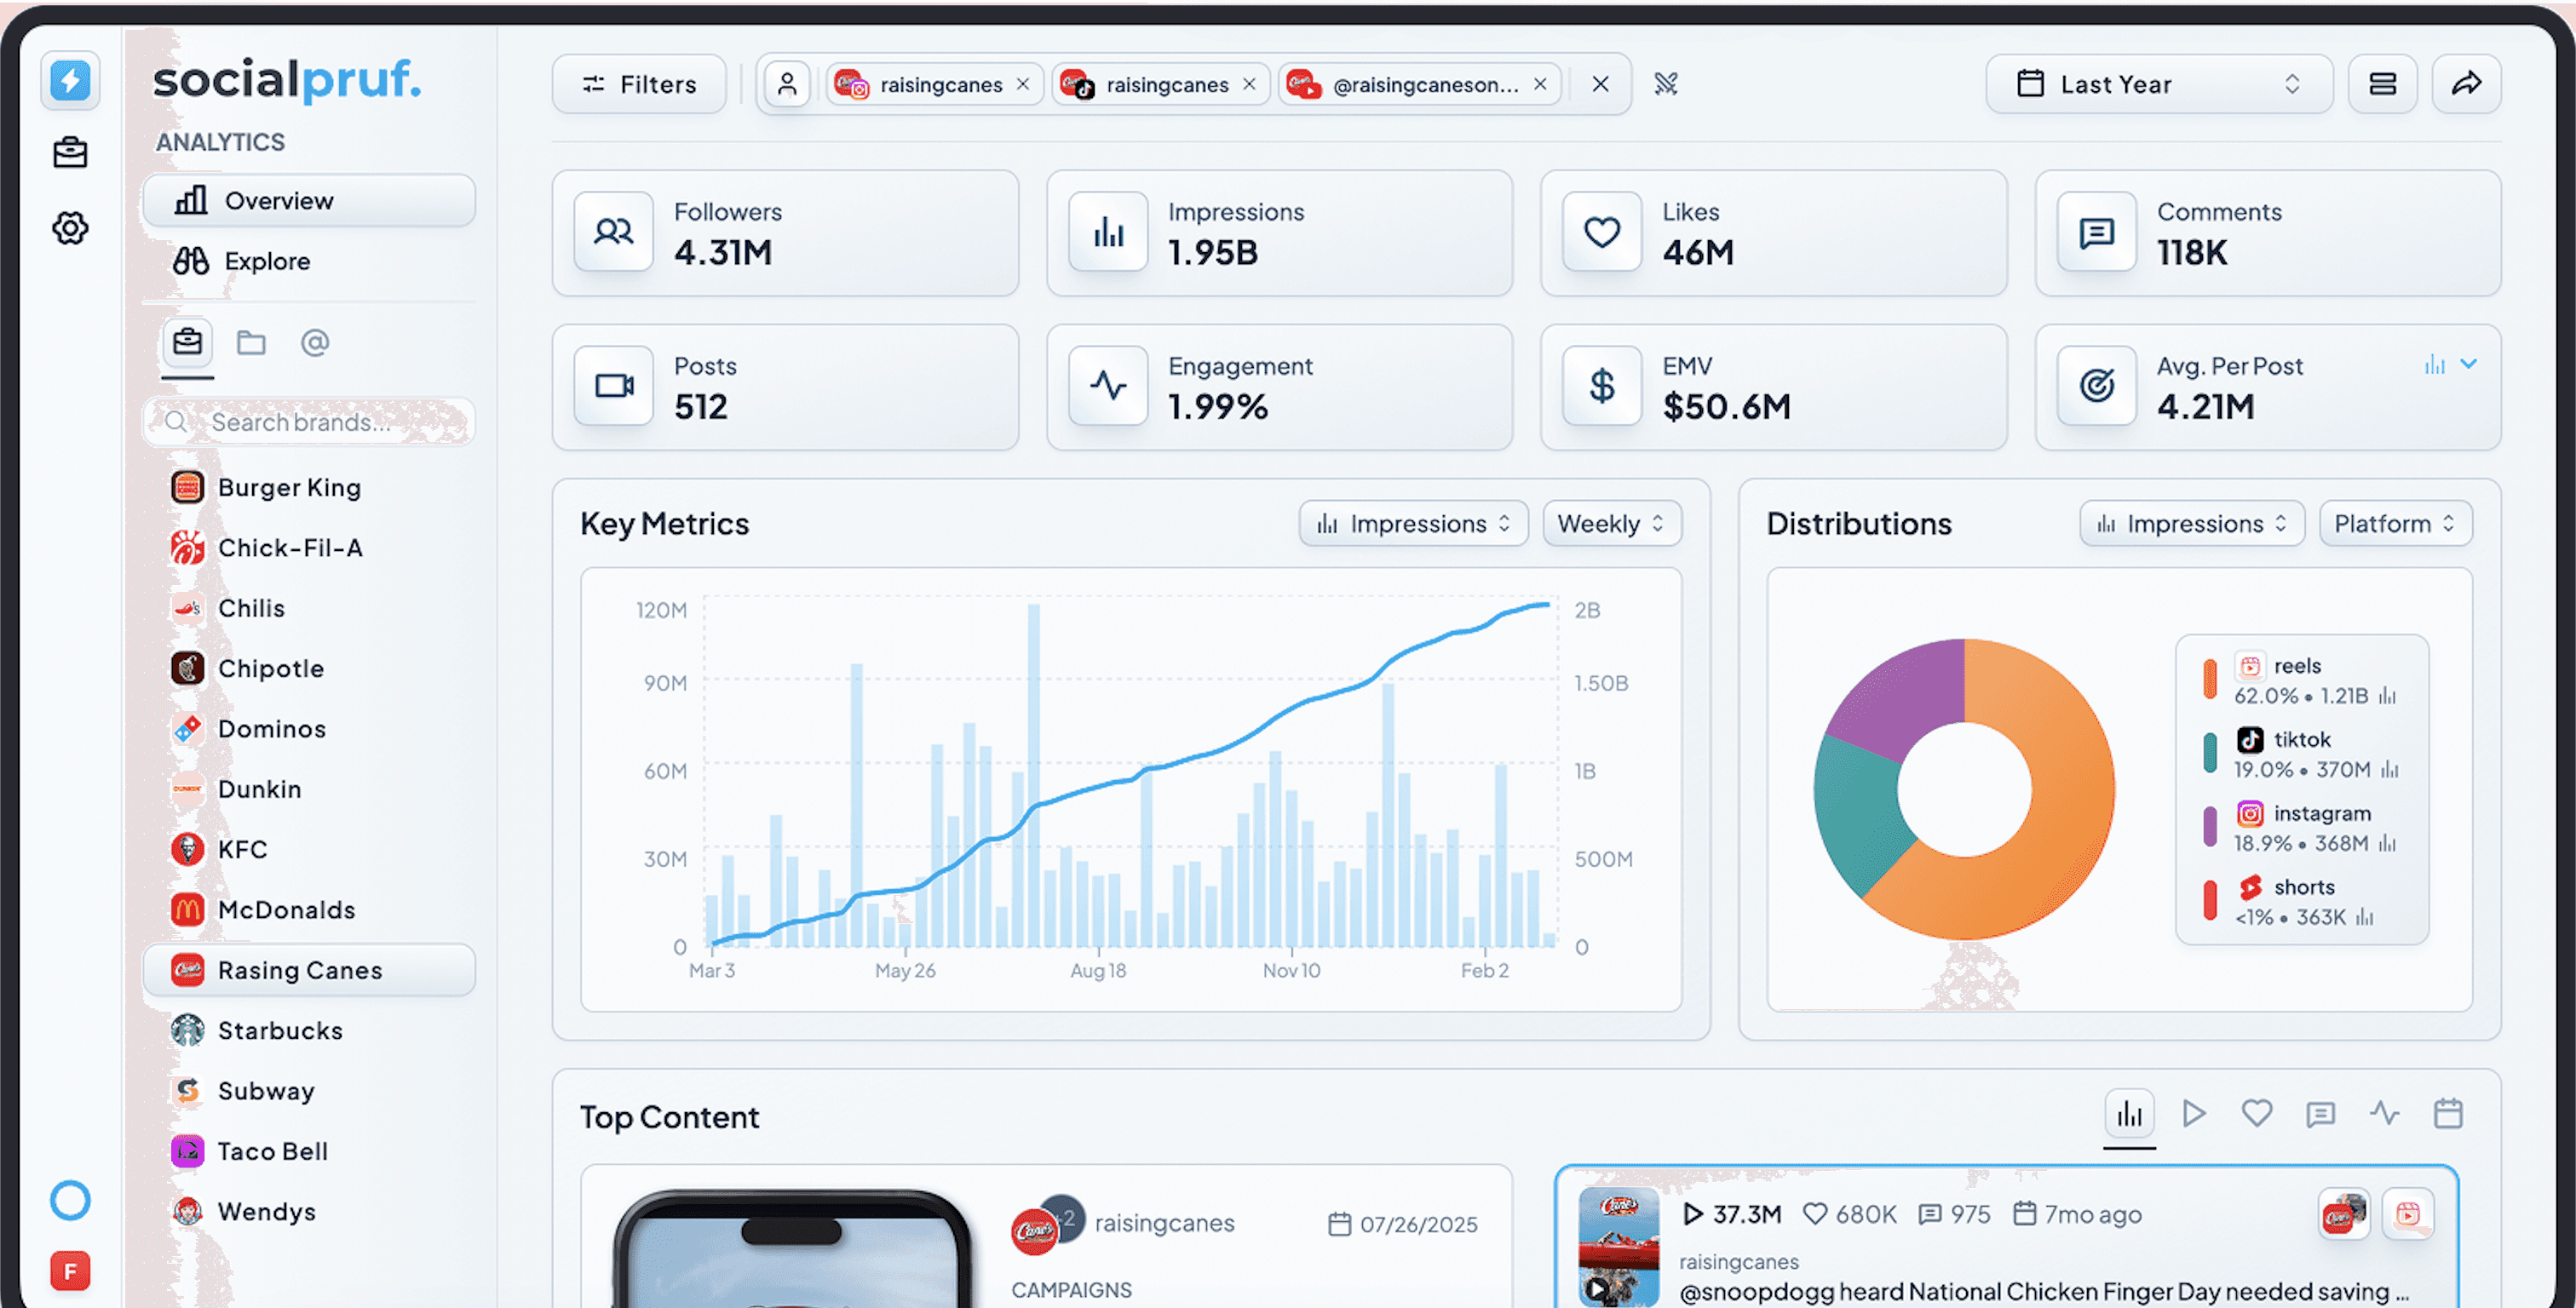

Comparing competitors on raw follower counts and impressions tells you who is biggest, not who is winning. Normalize by audience size, separate organic reach from paid amplification, and you get a benchmark you can actually act on.
Overview
The biggest mistake in competitive analysis is comparing raw numbers across accounts of different sizes. A competitor with ten times your audience will beat you on impressions every month, and that fact tells you nothing you can act on.
Fair benchmarking means answering two questions instead: how much of each account's audience is actually being reached, and how much of that reach was paid for. This guide walks you through how to:
- Set up a competitive landscape inside Socialpruf for ongoing tracking
- Sort by growth in Table View to find who's winning the audience battle
- Benchmark fairly using audience-relative metrics like Impressions per Follower
- Separate genuine content performance from paid amplification using Organic Impressions and Boosted flags
- Identify and study the top-performing campaigns running in your space
- Run head-to-head comparisons between your accounts and your competitors
By the end, you'll have a benchmarking workflow that surfaces who's actually winning in your space, and a steady stream of creative inspiration from their best-performing campaigns. The report embedded above is a live example, click into it and sort the columns as you read.
Step 1: Set up your competitive landscape
Before you can benchmark, you need your competitors' accounts loaded into Socialpruf and organized in a way that makes them easy to filter as a group.
Load your competitor accounts
- Head to Manage → Accounts.
- Click Track Account in the top right.
- Paste each competitor's URL (or search by name) and add them in batch.
- Assign them to a brand. Create a new "Competitors" brand, or split them across multiple brands by tier (Direct, Aspirational, Adjacent).
Organize for fast filtering
Keep your own brand separate from your competitor brands so you can flip between viewing yourself and viewing the landscape with a single click in the left rail. If you have many competitors, drag and drop competitor brands into a folder so you can filter the entire competitive landscape as one unit.
Step 2: Sort by growth in Table View
With your landscape loaded, the first question to ask is: who's gaining the most ground right now? Audience growth is a leading indicator, it tells you who's getting attention even before you see what they're posting.
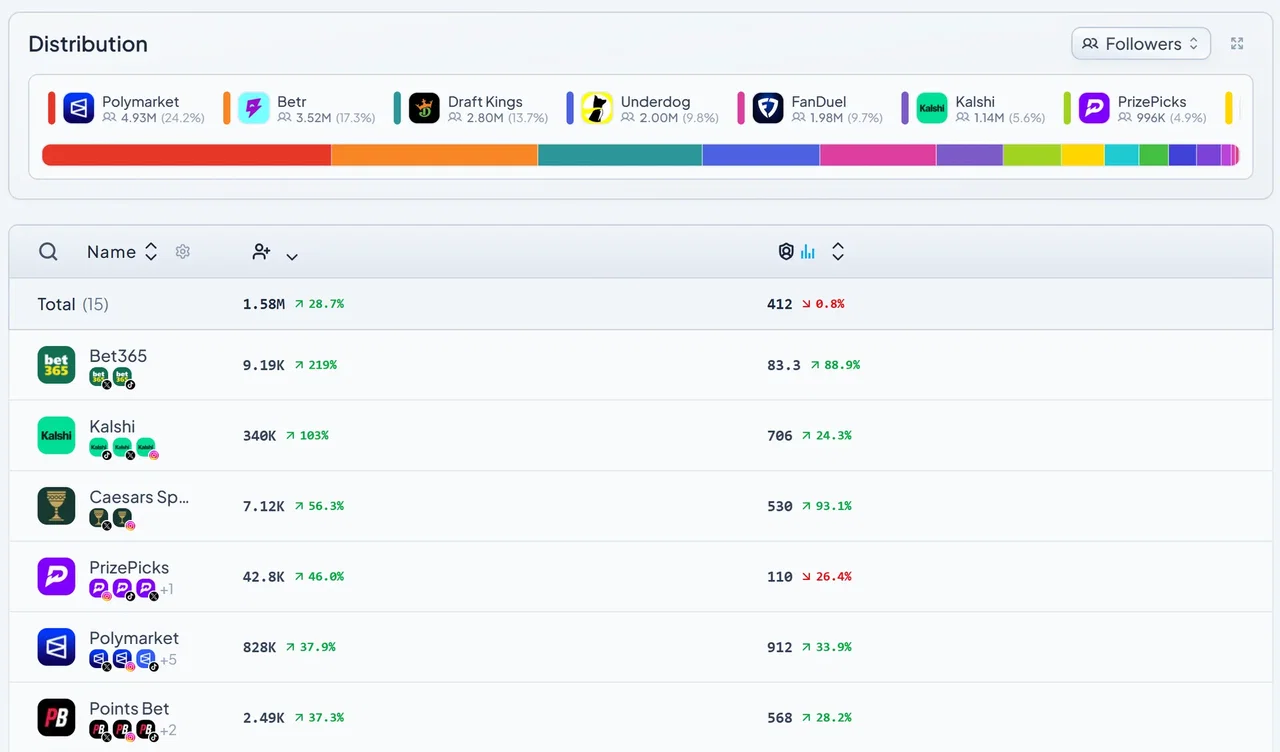
To rank competitors by growth:
- Open the Overview page.
- Switch to Table View in the top right.
- In the left rail, filter by your Competitors brand (or folder).
- Set the time filter to a meaningful window: Last 30 days for fast-moving signals, Last 90 days for sustained trends.
- Click the KPI column header you value most to sort by descending growth. The fastest-growing accounts surface at the top. You can try this in the embed above.
The accounts ranking high here are doing something that's working right now. They're the first ones to dig into when you get to Step 4.
Step 3: Benchmark fairly with audience-relative metrics
Raw numbers mislead when you're comparing accounts of different sizes. The fix is to normalize by audience.
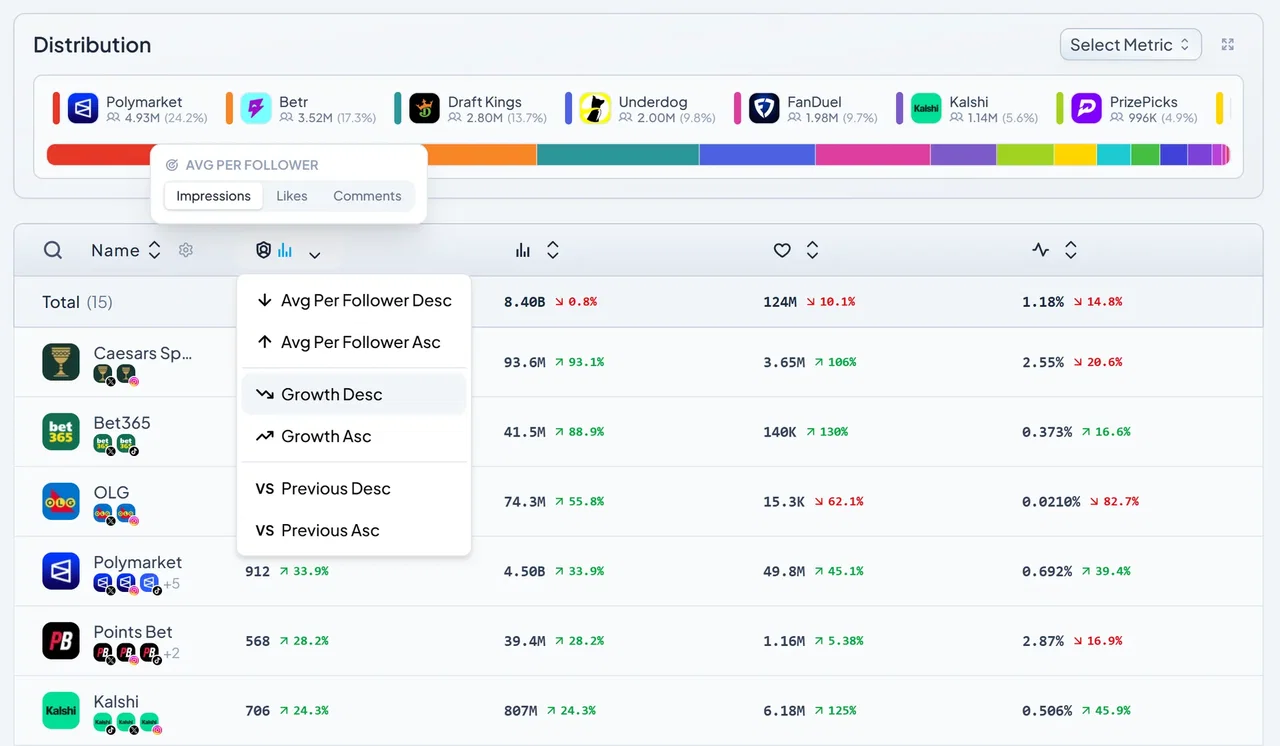
Switch to Average Per Follower
The metric you want is Average Per Follower with Impressions selected as the underlying value, also known as the impressions-to-follower ratio.
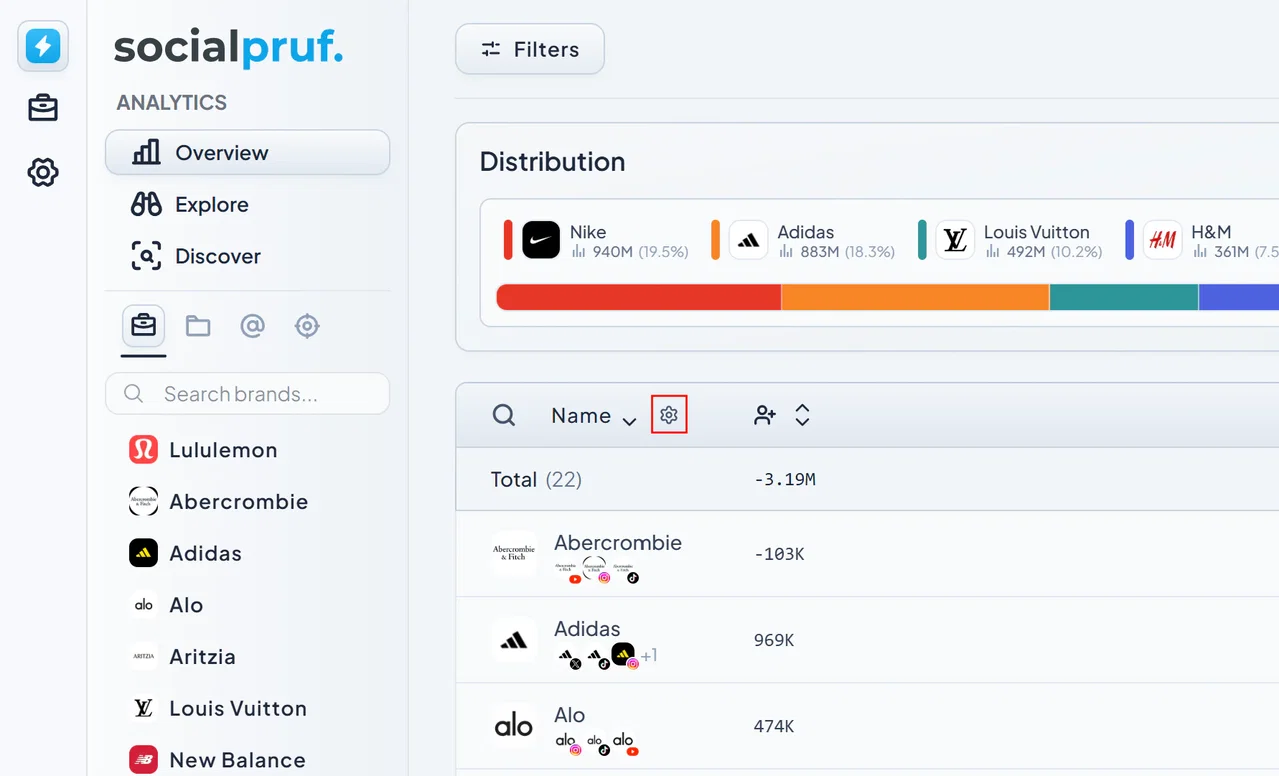
It isn't shown by default, so you'll need to add it as a column first. Click the gear icon next to the column header in Table View to open settings, then toggle on the KPIs you want. Every metric you enable here becomes its own sortable column, so this is where you turn on Average Per Follower, along with any other benchmark metrics you want to rank by.
- In Table View, click the gear icon in the column header and add the Average Per Follower KPI.
- Use the dropdown on the metric widget to set the underlying value to Impressions.
- Sort the table by this column.
You're now looking at how much of each account's audience they're actually reaching with their content.
What to look for
- High Impressions per Follower: strong content distribution. The algorithm is rewarding their posts.
- Smaller accounts punching above their weight: their playbook transfers to you, because it works without an audience advantage.
Other audience-normalized metrics to layer in
- Engagement Rate - already audience-normalized (likes + comments ÷ impressions). Use it to see how deeply audiences are reacting.
- Follower Conversion - how effectively each account turns views into new followers. A growth-quality signal.
- Average Per Follower with Likes selected - engagement intensity per audience member.
Strip paid amplification with Organic Impressions
Even after normalizing for audience size, you're still mixing two different signals: content that organically resonated, and content that was paid to be shown. A competitor running heavy paid amplification will look strong on raw or even per-follower impressions, but that tells you their budget is winning, not their content.
Socialpruf separates these signals with two related metrics:
- Organic Impressions - estimated impressions with boosted outliers stripped out. The cleanest read on which competitors are winning on content quality alone.
- Boosted - a flag on individual posts that likely received paid amplification, based on view counts crossing platform-specific thresholds with unusually low engagement.
How to read them:
- In Table View, set the widget to Organic Impressions as a value and sort by that column.
- Compare each competitor's raw Impressions column against their Organic Impressions column. A wide gap means they're leaning heavily on paid amplification; a narrow gap means most of their reach is genuinely earned.
- On the Explore page, filter to a single competitor and look for the Boosted flag on their top posts. The ratio of boosted to organic in their best-performing content reveals their amplification strategy at a glance.
Step 4: Study competitors' top-performing campaigns
Once you know who's winning, the next move is to study what they're posting. This is where competitive benchmarking turns into creative fuel.
Find their best content
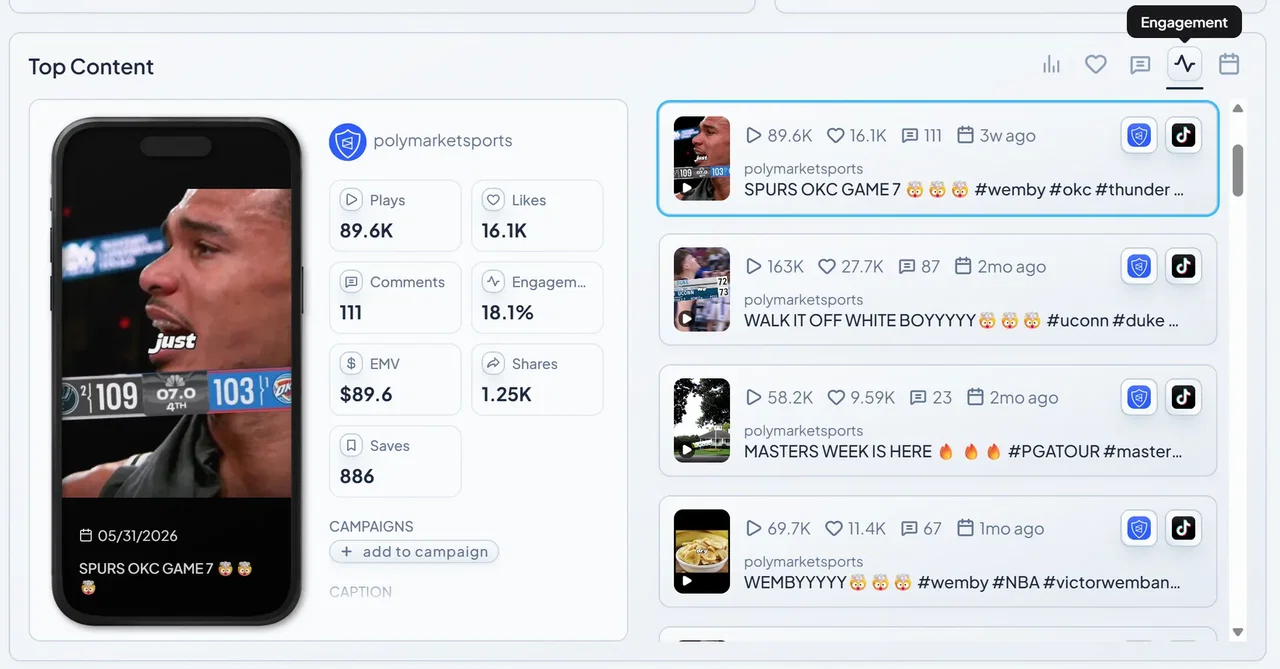
- From Table View on the Overview page, click into a high-performing competitor. The dashboard reshapes to show just that account.
- Scroll to the Top Content section at the bottom.
- Sort by your metric of choice: Impressions, EMV, Engagement Rate, or Average Per Follower.
You're now looking at their highest-performing posts, ranked by whatever lens matters most to you.
Spot patterns with Explore page insights
- Open the Explore page with the competitor filtered.
- Click View Insights and check Top Mentions to see who they collaborate with.
- Review the Virality Distribution to see how often they're hitting outsized performance.
- Run keyword searches for category-specific terms to surface campaign themes.
Group their content into campaigns
If a competitor ran multiple posts around a launch or theme, add those posts to a campaign. You'll get aggregated performance data for their full campaign. Useful for asking, "when they did X, how big did it actually get across the whole push?"
Step 5: Run head-to-head comparisons with Compare mode
For tighter, one-to-one analysis, use Compare mode to put your account directly against a single competitor across every KPI.
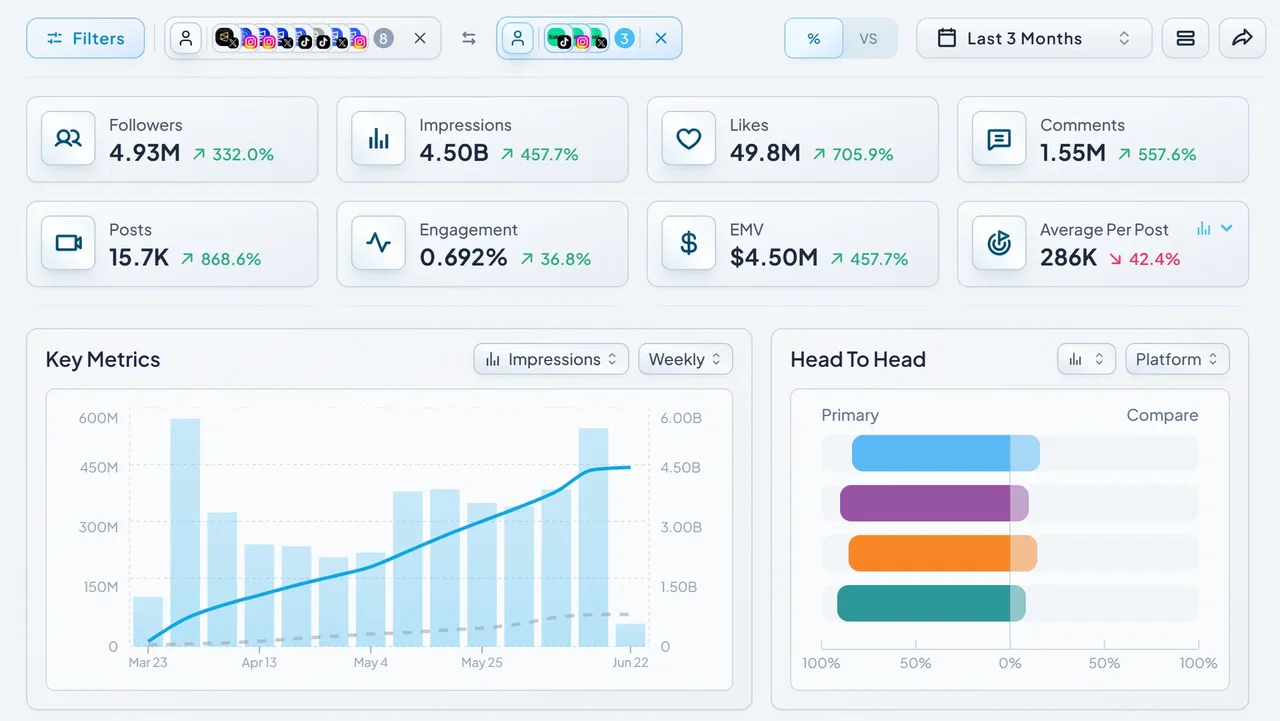
To run a head-to-head comparison:
- On the Overview page, filter by your own brand or account.
- Click the three dots next to the filter and select Compare.
- Choose the competitor account or brand to compare against, then click Compare.
You'll see side-by-side metrics across every KPI for the time period you've selected. Toggle between percentage and whole-number views to see the gap clearly.
Final takeaway
Competitive benchmarking goes wrong when it stops at size. Follower counts and raw impressions rank accounts by how big they already are, which is the one thing you can't change this quarter.
Normalize by audience and strip out paid amplification, and the ranking changes shape: you see which accounts are earning attention per follower, which are buying it, and which small accounts are running a playbook worth copying. Set it up once and it becomes a standing intelligence loop, who's gaining ground, what they're posting, and how you stack up, on whatever cadence you report.
What you'll have built:
- A loaded competitive landscape, organized into brands and folders for fast filtering.
- A growth ranking in Table View showing who's gaining audience fastest in your space.
- Audience-normalized benchmarks (Impressions per Follower) that compare accounts fairly regardless of size.
- A way to strip out paid amplification with Organic Impressions, so you're benchmarking content, not media budgets.
- A research workflow for studying competitors' top-performing content and spotting patterns.
- Head-to-head comparison for tight, one-to-one analysis using Compare mode.