AI is a genuinely capable social analyst: it can calculate metrics, find patterns, build charts, write recaps, and push results into your other tools. What separates a useful answer from an invented one isn't the prompt, it's the data you hand it.
An AI assistant is a better social analyst than most people give it credit for. It can compute the metrics you'd normally build a spreadsheet for, spot patterns you weren't looking for, draw the chart, write the recap, and drop the result into the doc your team actually reads, in the time it takes to type the question.
The reason it so often disappoints has nothing to do with the model. It's that most people hand it a screenshot and hope. Get the data part right and the same assistant becomes the fastest analyst on your team.
This guide covers both halves: everything AI can genuinely do with social data, then how to give it data worth working with.
1. Measurement: the numbers you'd otherwise build by hand
The most immediate win is arithmetic you stop doing yourself. Given post-level data, an assistant can roll up totals and averages per platform, calculate engagement rate where it isn't already a column, work out earned media value by month or campaign, and rank your best and worst performers on whatever definition of "best" you care about today.
The useful part is that the definition is negotiable. Ranking by raw views flatters your biggest account; ranking by engagement rate flatters your smallest. You can ask for both in the same breath and see which story holds up.
"Rank every post last quarter by engagement rate, then again by total impressions, and show me which posts appear in the top ten of both."
It's also good at the ratios nobody bothers to compute manually: saves per view, comments per like, shares per thousand impressions. Those are usually where the real signal about content quality lives, and they're exactly the kind of thing that gets skipped when the calculation is tedious.
2. Analysis: patterns, correlations, and honest answers
Once the math is trivial, the interesting question becomes why. This is where AI earns its place, because it will happily test twenty hypotheses in a row without getting bored or attached to any of them.
Things worth asking about:
- Format and length. Do your shorter videos out-earn the long ones? Is there a runtime where completion falls off a cliff?
- Timing. Which day and hour genuinely outperform, once you control for how many posts you actually published in each slot?
- Concentration. What share of your total reach comes from your top 5% of posts? For most accounts the answer is uncomfortable and extremely useful.
- Content themes. If your data includes captions, you can have the assistant tag posts by topic, tone, or hook style and then compare performance across those groups. This is genuinely hard to do by hand and trivial to ask for.
- Anomalies. "Find weeks where reach dropped more than 30% versus the prior week and tell me what was different about what we posted."
One caution worth building into your prompts: an AI will find a correlation in anything if you let it. Ask it to tell you the sample size behind each pattern and to flag the ones that are probably noise. A good assistant will say "this is based on four posts, don't act on it." A bad prompt will let it present four posts as a trend.
3. Visualization: charts without the chart-building
Most AI tools will draw directly from your data, so the gap between "I wonder" and "here's the chart" collapses to one sentence. The standard set covers more ground than people expect:
- Line charts for impressions, followers, or EMV over time
- Bar charts comparing platforms, accounts, campaigns, or months
- Scatter plots for relationships, video length against views being the classic
- Heatmaps for day-and-hour posting performance
- Stacked areas for how your platform mix has shifted over the year
The real advantage is iteration. The first chart is rarely the right one, and re-asking costs nothing: "same chart, but exclude paid posts, and highlight the three biggest outliers." Doing that in a spreadsheet is ten minutes of clicking. Here it's ten seconds, so you actually keep going until the chart says something.
4. Reporting: turning numbers into something you can send
Rows and charts still aren't a deliverable. The last mile, writing the thing a client or an executive reads, is work AI does well because it's mostly translation.
You can get monthly performance recaps, two-paragraph summaries for a stakeholder who won't open the deck, talking points for a review meeting, a plain "what worked and what flopped" narrative, or a quarter-over-quarter comparison with the context filled in. The same underlying numbers get written up three different ways for three different audiences without you rewriting anything.
The trick is specifying the audience and the length up front. "Write a 150-word summary for a CMO who cares about efficiency, not volume" produces something you can send. "Summarize this data" produces filler.
5. Integration: connecting it to where you already work
Analysis that lives in a chat window has a short shelf life. The step most people miss is pushing results into the tools their team actually uses, and assistants can increasingly do this directly when they're connected to those tools:
- Docs and slides for the recap or the monthly deck
- Spreadsheets for a maintained tracker rather than a one-off answer
- Slack for a weekly digest posted to the channel
- Project tools and CRMs for logging campaign results next to the campaign
This is also where scheduling comes in. A monthly report that regenerates itself against current numbers is a fundamentally different thing from one you rebuild every month, and it only works if the assistant can reach the data on its own, without you exporting anything first. Which is the theme of the second half of this guide.
6. Research: competitors, benchmarks, and creative teardowns
The last capability is the one that most changes how you plan. AI is good at comparison work: benchmarking your engagement rate against competitors in your category, tracking how a rival's posting cadence has changed, breaking down what their best-performing content has in common, or finding the gap between what you post about and what actually performs in your space.
This one has a hard dependency, though. You can only compare against accounts you have data for, and your own export contains exactly one account: yours. Hold that thought.
The part everyone skips: how the AI gets your data
Every capability above assumes the assistant can see real numbers. That assumption is where most "AI for analytics" attempts fall apart.
Screenshots: the weakest but quickest option
Pasting a screenshot of your dashboard is a shortcut that makes it hard for the AI to read your data. It's reading pixels, inferring characters from them, and reconstructing what it thinks the table said. It can miss a row cut off at the edge, confuse which column a value belongs to, etc. It can work for quick questions but shouldn't be used for anything that's going out of your chat.
It's also structurally limited, a screenshot holds one view, of one account, for one date range. You can't ask a follow-up that needs data outside the frame, which means every interesting second question dead-ends.
Use screenshots to ask "what does this metric mean?" Never to ask "what's my number?"
Spreadsheets: strong, but frozen
A CSV export is a genuine step change. The AI stops guessing and starts calculating, because a spreadsheet gives it what it actually needs: rows, columns, and typed values it can compute over.
Structure is the whole unlock. A good social export is post-level, one row per post, with each metric in its own column:
| posted_at | platform | impressions | likes | comments | shares | caption |
|---|---|---|---|---|---|---|
| 2026-06-02 | tiktok | 44,700,000 | 1,620,000 | 21,400 | 199,000 | Top 10 AI Models |
With that shape, "which platform had the best EMV per post last month?" becomes answerable, because every value the assistant needs is a column it can read and divide. Most of sections 1 through 4 above work fine on a decent CSV, and if you want to try any of this today, this is the fastest way in.
Getting the export. Every major platform lets you download your own analytics, and the specifics change often enough that the platform's own docs are the only reliable reference. Broadly: Instagram and Facebook export through Meta Business Suite (Professional or Creator account required), TikTok through TikTok Studio on desktop, X through its analytics dashboard behind X Premium, and YouTube and LinkedIn through their respective studio and page analytics.
The catch: a CSV is a snapshot, so it's stale the moment it lands in your downloads folder. Export windows are typically capped at 60 to 90 days, stats often come as separate files you have to stitch together, and some platforms charge for the privilege. Refreshing means re-exporting, re-merging, and re-uploading, every single time.
That kills the good parts. No scheduled reports, because nothing regenerates. No competitor work, because your export only contains you. No long-range trend analysis, because you can't see past the export window. No self-updating growth model, because the model freezes on the day you downloaded. The assistant is only ever as current as your last manual chore.
Live connection: MCP
The third option removes the chore entirely. MCP, the Model Context Protocol, is the open standard that lets an AI assistant connect straight to a data source and query it as needed. Instead of handing over a file, you hand over a set of tools the assistant calls itself, pulling exactly the data each question requires, at the moment you ask it.
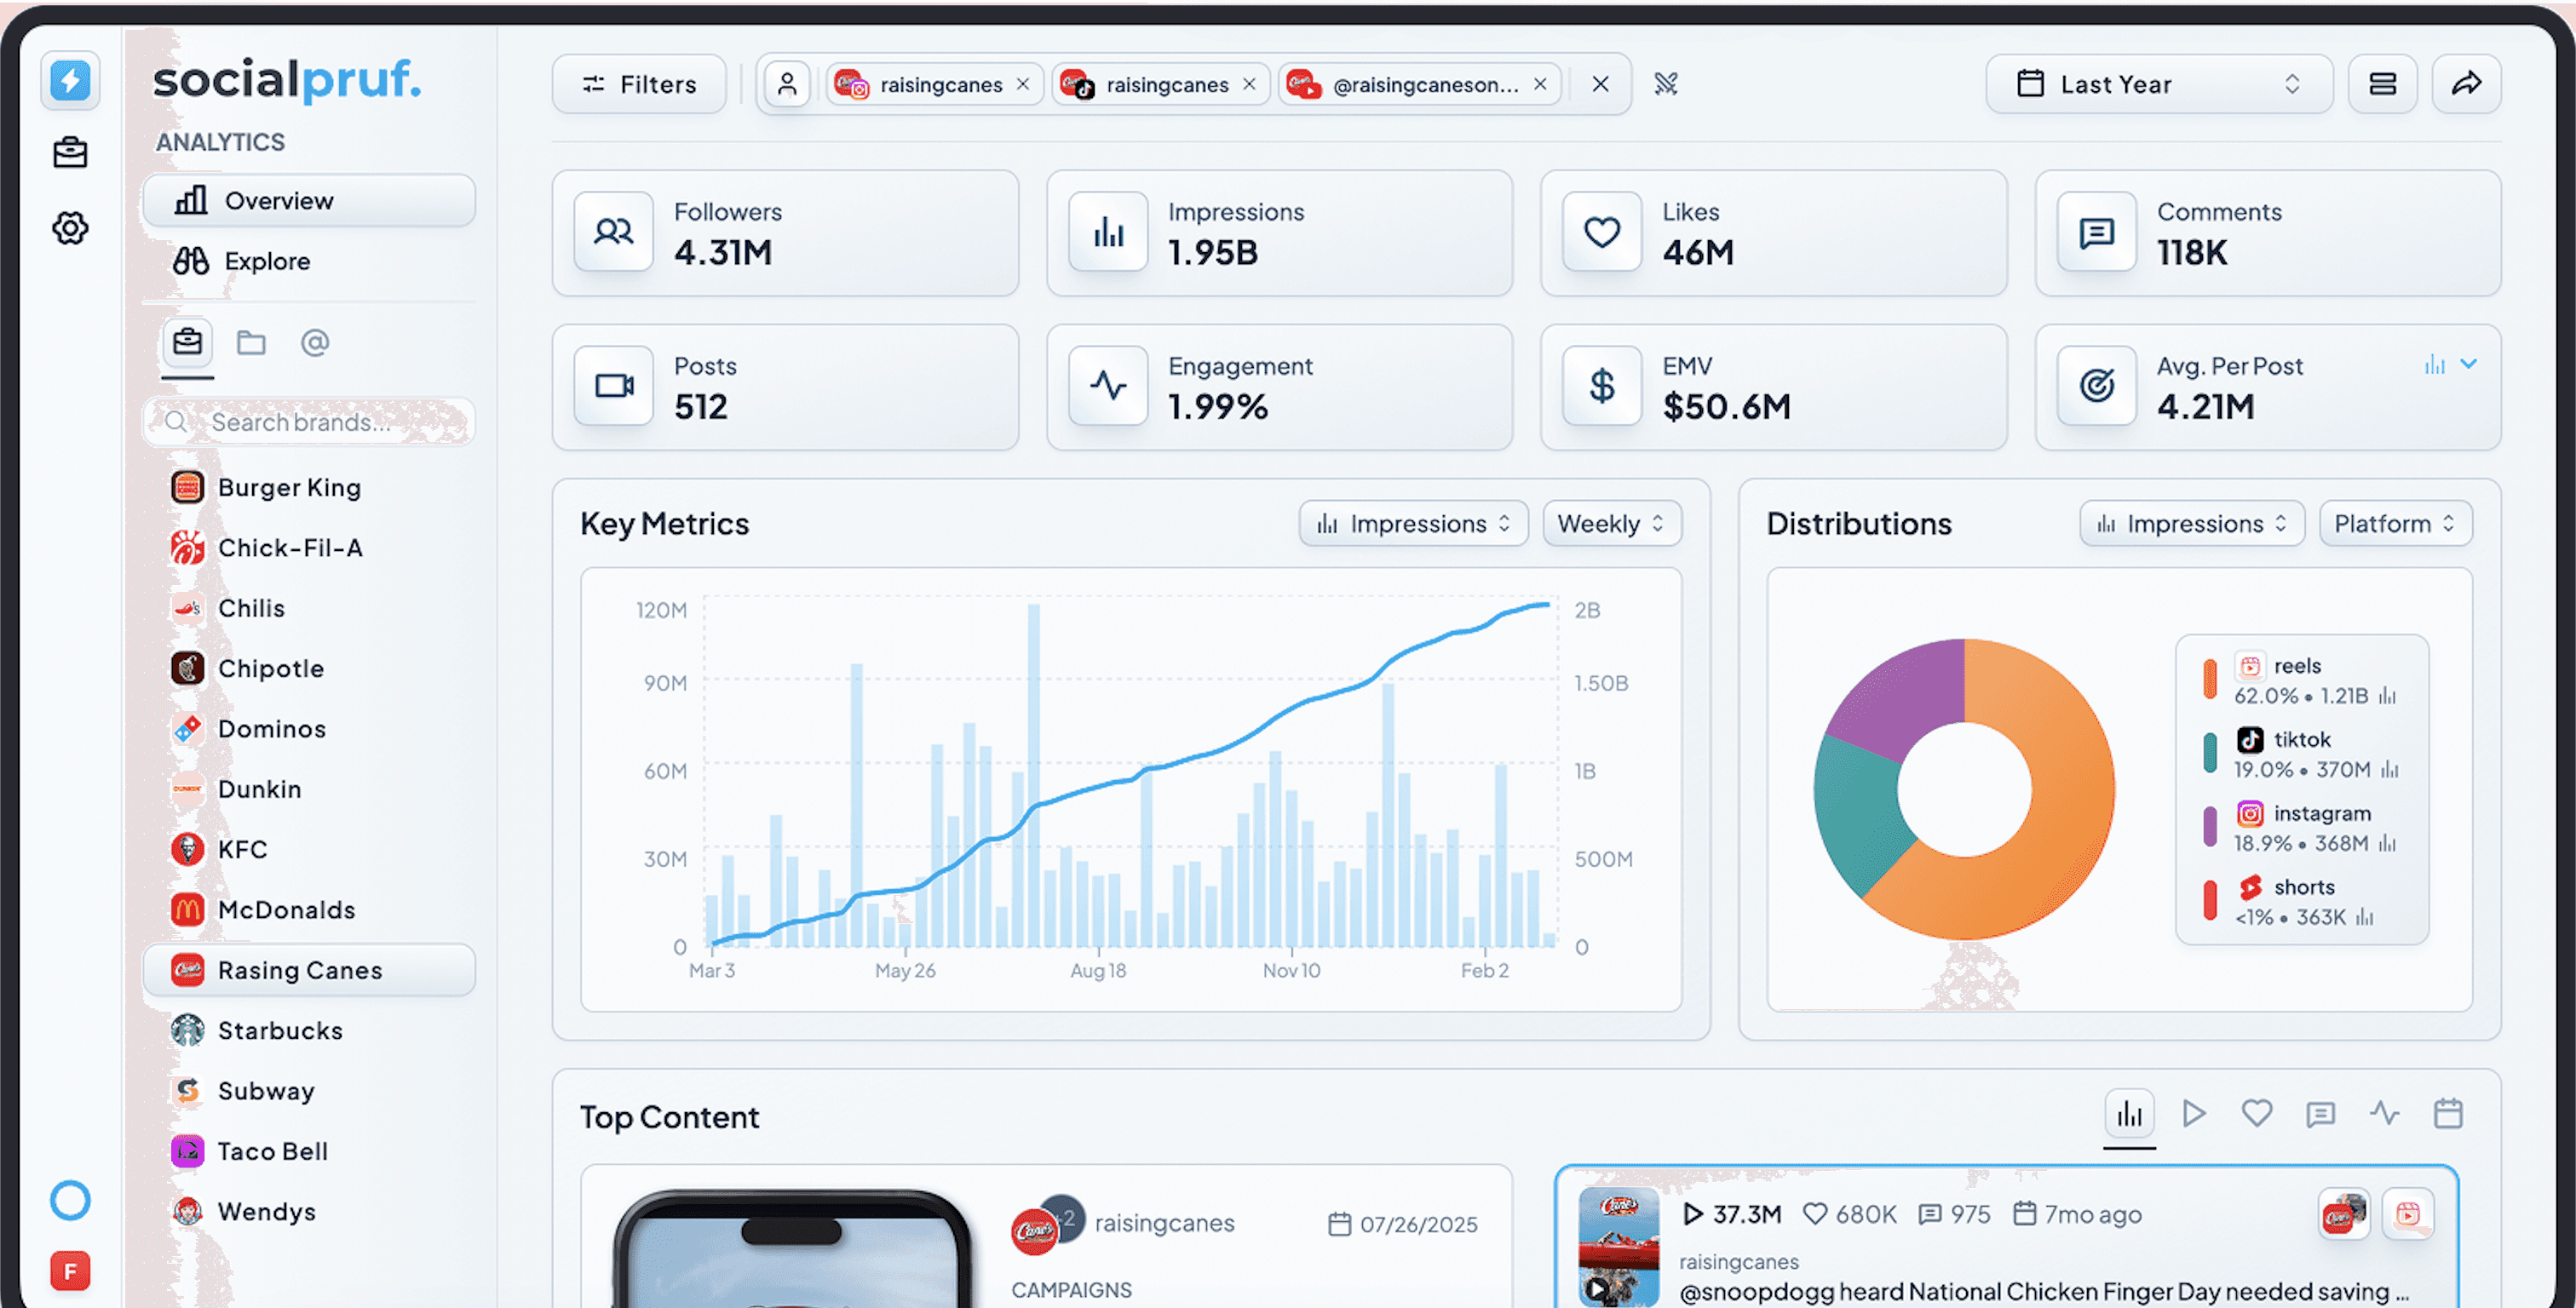
The Socialpruf MCP gives an assistant the full surface: list your teams and accounts, pull KPI totals, break stats down by account, brand, or campaign, chart any metric over time, inspect a single post's growth curve, read audience demographics, and search posts with rich filters. Setup is adding a connector in your AI platform and pasting one link.
What changes once it's live:
- Nothing goes stale. Ask the same question next month and it re-runs against current numbers. Growth models and scheduled reports finally work, because there's no snapshot to expire.
- Every account at once. "How did we do across everything last quarter" is one question, not a six-file merge.
- Competitors are in scope. You can benchmark against public accounts you don't own, which no export of your own data will ever let you do.
- Full history, not a 90-day window. Trend and seasonality analysis needs more runway than any platform export gives you.
- The numbers are auditable. Ask where a figure came from and it points you at the exact posts behind it. That's the difference between a number you'll defend in a meeting and one you'd rather not be asked about.
Final takeaway
The capabilities are not the bottleneck. AI can already measure, analyze, visualize, report, and integrate at a level that makes most manual social reporting look like busywork, and it will keep getting better at all of it.
What decides whether you get value is the input. Screenshots give you fiction. A CSV gives you a real but frozen answer, and it's a perfectly good place to start today. A live connection gives you an assistant that's current, complete, and checkable every time you open it, which is the only version of this that survives contact with an actual reporting cadence.
The Socialpruf MCP comes with our subscription and connects in under a minute.