

Almost everything that makes a goal feel wrong later traces back to one fact: the number got picked because it felt ambitious, not because anything in your data said it was real. Fix that and the rest falls into place.
The short answer
A goal you can defend comes from three places: what your own numbers say is possible, what your market says is normal, and which metric is actually worth counting.
Why most goals don't survive
A bad goal usually fails for one of a few reasons. Here they are in plain terms.
It has no deadline that means anything. "Grow engagement this year" can't actually come due. Without a real date, there's no moment where you check the prediction and learn something, which is the whole reason to set one.
It has no evidence behind it. Ask why the number is the number and you usually get a shrug. It's round, it's bigger than today, it sounds right. None of that is a reason, and a goal with no reason can't teach you anything whether you hit it or miss it.
It's borrowed from someone else. A competitor posted big numbers, so their number becomes your target. But their budget, audience, and head start aren't yours.
Your only strategy is posting more. Not learning from your post sprints, past campaigns and failed viral baits is a waste. You need to know what is performing and where your stats actually shift.
So how do you set one you can actually defend?
If the problem is that the number came from nowhere, the fix is to make it come from somewhere. A goal you can stand behind answers three questions, and you work through them in order.
What's possible?
You need to look back at what your own data is telling you and see where your projections lie. If you keep posting the same as you are today, where will you stand in 3 months? This is your starting point.
What's normal?
This is when you look beside you to find out where your industry is performing. Don't worry I'm not going to tell you to copy your competitors' top 10 posts for the millionth time. Instead, look for real performance factors that you can learn from.
What's worth counting?
You decide.
Get those three right and the number mostly picks itself.
Start with your own last 90 days
Use the last 90 days of your social performance to find out where you are projected to sit 3 months from now. Say your followers went 2,000, then 2,180, then 2,400. That's about 9% of consistent growth. Learning to increase stats like your monthly follower growth is significantly more valuable than trying to go viral once. Don't be afraid to be consistent, using projections will help you stay on a positive track, followers and interaction will compound over time. Over time you will learn to adapt your performance cycles and find what engages your audience. This will build your content base while you test out your most creative ideas.
At Socialpruf we determine projection using this formula: Projected final = what you've already accumulated in the goal window + (average daily rate × days remaining)
Try it out yourself!
Project your goal
Then check it against the field
Here's where a lot of advice steers you wrong: Find a competitor, see what they're doing, aim for it. In reality the competitor you're watching has a different budget, a different audience, a different head start. Copying their number is guessing all over again, just outsourced. Monitoring competitors is how you learn quickly and start managing social media proactively, not how you set goals.
Here's a few things to look for in competitor data:
Seasonality. If your industry is seasonal, your social media stats will be too, you can predict this by looking at your industry's stats and react accordingly. Sometimes a sanity check is more valuable than ad spend.
Big numbers move slower. Holding 10% growth at 2,000 followers is easy. At 200,000 it's brutal. Find out how similar sized accounts are performing so you know when to expect the rates to soften.
Posting frequency vs growth rate. Are they growing faster because they post more, or because each post performs better?
Content mix contribution. What percentage of their growth is coming from reels, carousels, static, etc.?
Beyond trend spotting, watching competitors can help with your brand's positioning. It will show undervalued audiences and missed content angles that nobody is covering. Social listening can reveal how others talk about themselves, helping you define what makes your brand different, instead of sounding generic.
Finally, don't get me wrong, comparing yourself against the biggest brands can be fun, find your wins and celebrate them.
Point it at a metric that's worth the effort
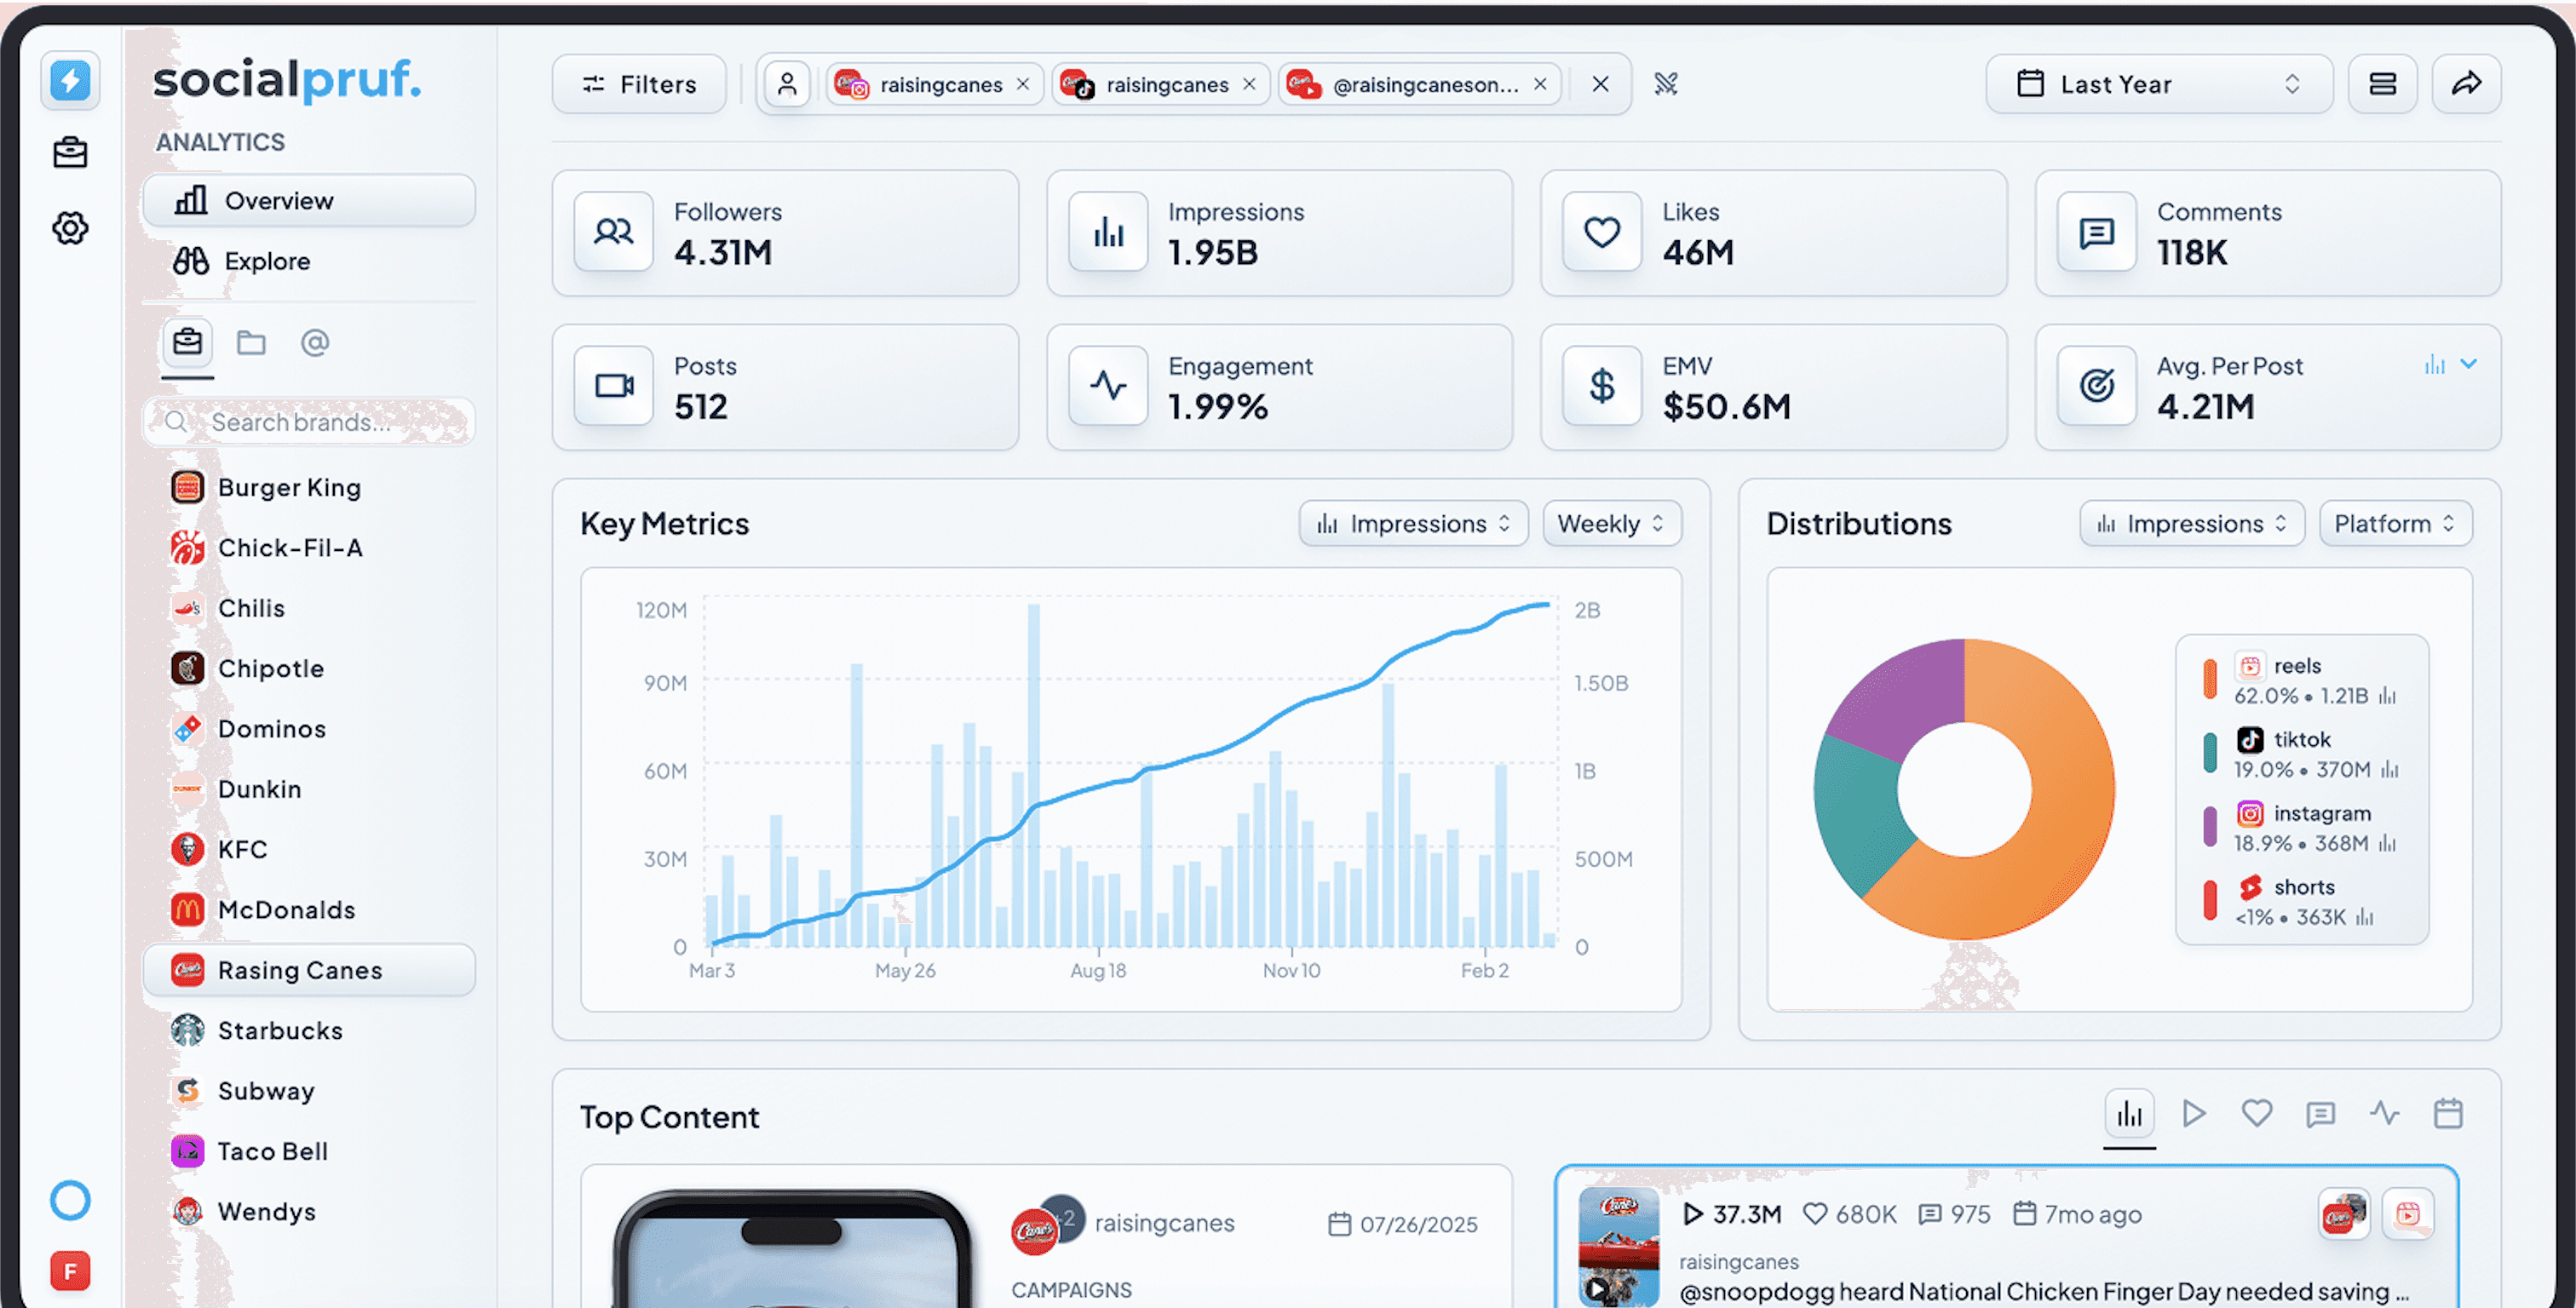
A goal is only as good as the thing it measures. Aim at the wrong metric and you can nail it while the business gets nothing. The first cut is vanity versus value: followers and impressions climb when things go well, but on their own they can rise while your audience tunes out. At Socialpruf, the metrics worth a goal are the ones that survive the question "and then what?"
A few that pass, with the math so you're not hand-waving.
Engagement rate tells you whether people actually respond. Divide by reach and you learn how good the content was for the people who saw it.
Our Equation: (Likes + Comments) / Impressions
Follower growth rate is new followers over where you started. The rate beats the raw count, because 1,000 new followers means something very different at 5,000 than at 500,000.
Our Equation: (Followers end − Followers start) / Followers start
Average Per Post is the measure of a specific KPI per post. It rewards consistent quality over outliers and highlights the importance of incremental growth.
Our Equation: total of the metric / number of posts
Share of voice is the distribution of your industry's total attention that you own. It makes growth relative. You can grow in absolute terms and still lose ground if everyone else grew faster, and this is the metric that catches it.
Our Equation: your impressions / (your impressions + competitors' impressions)
Earned media value is a dollar estimate of what your organic engagement would have cost to buy. Finance recognizes it, which makes it useful for goals that have to justify themselves outside the marketing team.
Our Equation: ($20 x CPM) + ($0.25 x Likes) + ($1.25 x Comments)
You don't need every stat. You need the one or two that match what you're trying to do. Chasing awareness? Reach and share of voice. Building a loyal core? Engagement rate and Average per post. Proving it paid off? Earned media value. The goal picks the metric, not the other way around.
Put it in one sentence
Put your three pieces together in one sentence. Your data has given you a plausible range, your competitors have given you your angle and your metric aligns with your business objective.
The template:
[Metric] moves from [today] to [your range] by [date], because [the evidence].
Filled in: "Engagement rate goes from 2.1% to between 2.9% and 3.2% by end of Q3, based on last quarter's positive trend and our defined gap strategy to reach new demographics."
Put that next to "let's hit 100k" and you can see the whole argument. It has a starting point, range, and a date, so it can actually come due. And it names its evidence, so when Q3 ends you can check the prediction and learn.
So next time someone reaches for a number because it sounds good, ask it out loud: what makes us think that's possible? If there's a real answer, you've got a goal. If there isn't, you've got a wish.